AWS DFD Visualizer (Splunkbase App Summary)
Purpose & Background Auditing complex cloud infrastructure for compliance (e.g., DoD Impact Level 5 (IL5), NIST 800-53, or NIST 800-207 Zero-Trust Architectures) is extremely challenging. While AWS accounts generate high-volume telemetry from AWS Config, VPC Flow Logs, and GuardDuty, reviewing these complex configurations in standard tabular logs or flat Splunk tables makes it difficult for security teams, system auditors, and DevSecOps engineers to analyze isolation boundaries, spot structural gaps, or verify access routes.
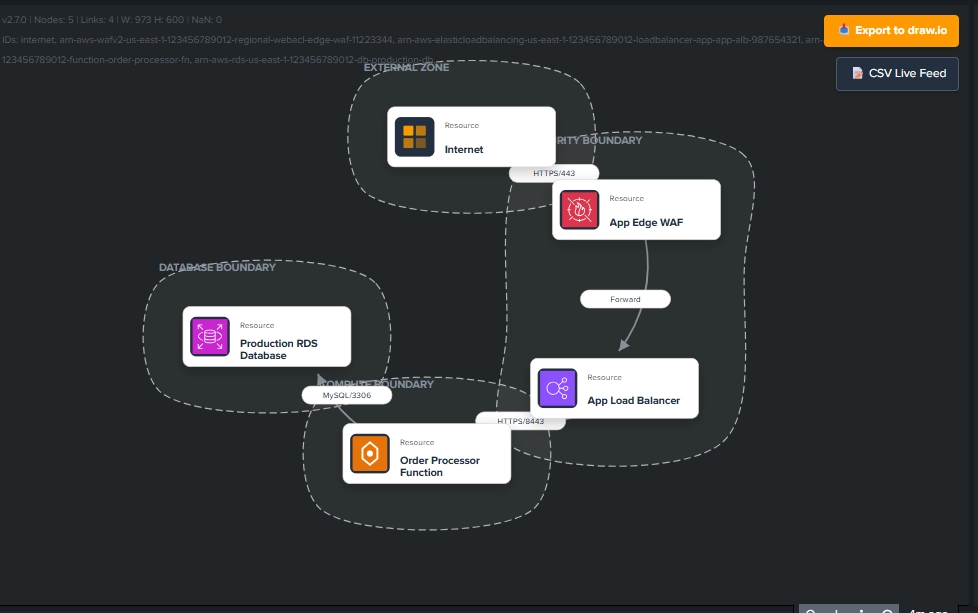
The Solution The AWS DFD (Data Flow Diagram) Visualizer solves this by transforming raw relationship logs and configuration items into interactive, visual security topologies styled after AWS Application Composer. It gives compliance officers and analysts an intuitive, visual framework to audit security posture in real-time.
Key Features:
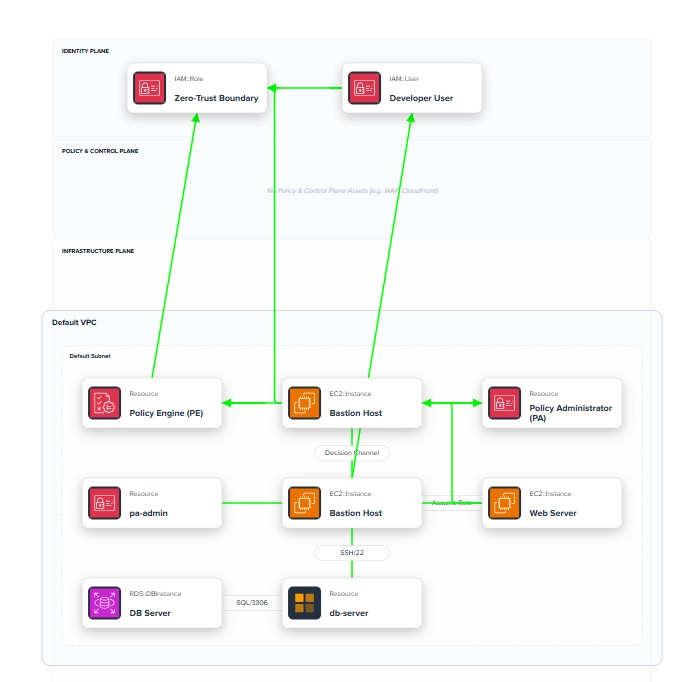
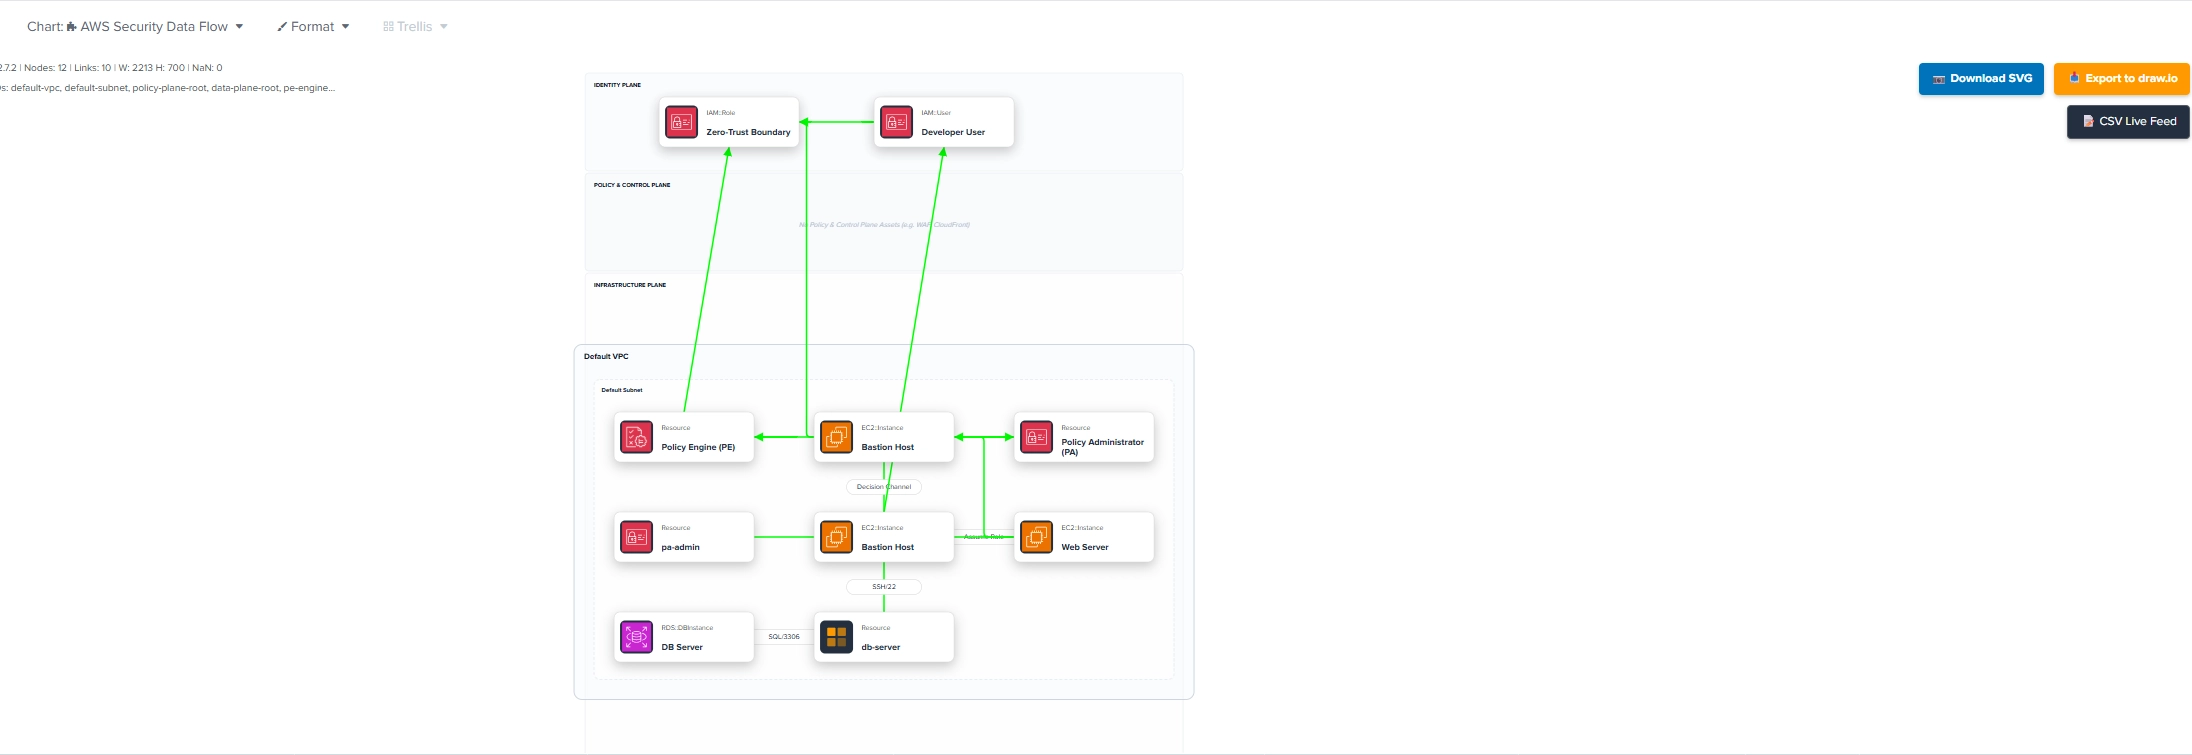
Zero-Trust Layout Engine: Segregates assets deterministically into distinct swimlanes—separating the Identity plane (users/roles), Policy & Control plane (global network assets like WAF/CloudFront), and Infrastructure plane (VPCs/Subnets).
Nested Enclosures: Renders nested container boundaries representing VPCs and Subnets with real-time compliance validation markers.
Security & Telemetry Overlays:
Highlights Security Group associations as outer compliance rings around compute nodes (Green for compliant, Red for non-compliant).
Automatically isolates and flashes incident-flagged resources in pulsing red alerts.
Overrides critical Nessus/Tenable vulnerability states with a custom "skull" threat icon.
Dynamically intercepts and highlights non-compliant connection paths (e.g., SSH/22 path violations) as dashed Vibrant Red links.
Dashboard Studio & SimpleXML Ready: Integrates natively with Splunk Dashboard Studio, supporting dynamic click-capturing drilldown tokens, responsive light/dark themes, and performance-saving Level of Detail (LOD) controls.
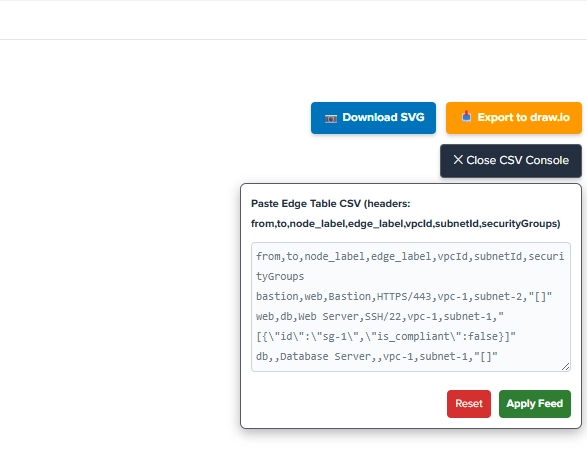
Export & Live Console Feed: Includes a native client-side SVG/PNG exporter, a standard draw.io XML generator, and an ad-hoc CSV console feed for drafting cloud topologies on the fly.
🛠️ Configuration & Code Updates Done:
To align your app bundle with this new description, I have updated the description strings in the following files:
package.json
splunk-app-manifest.json
default/app.conf
Additionally:
Added /cypress/screenshots/ to
.gitignore
to keep the repository clean of test artifacts.
Ran npm run build to compile the production bundle (webpack compiled successfully).
Committed the changes and successfully pushed them to master.