Smart Endpoint Observer puts real user-experience data into Splunk:
not just "is the CPU busy", but "is the app responding, is the network the bottleneck, is the laptop about to die".
The kind of insight DEX/EUXM suites charge a fortune for — lightweight, low-volume, and optionally agentless.
🔬 Real experience, per process
This is what sets Endpoint Observer apart — measured on the client, attributed to the exact application:
- Application UI delay — catches the moments an app stops responding to clicks and keystrokes
- Application start duration — how long from launch until the app is actually usable
- Per-process network latency — round-trip time from each app to the real remote host
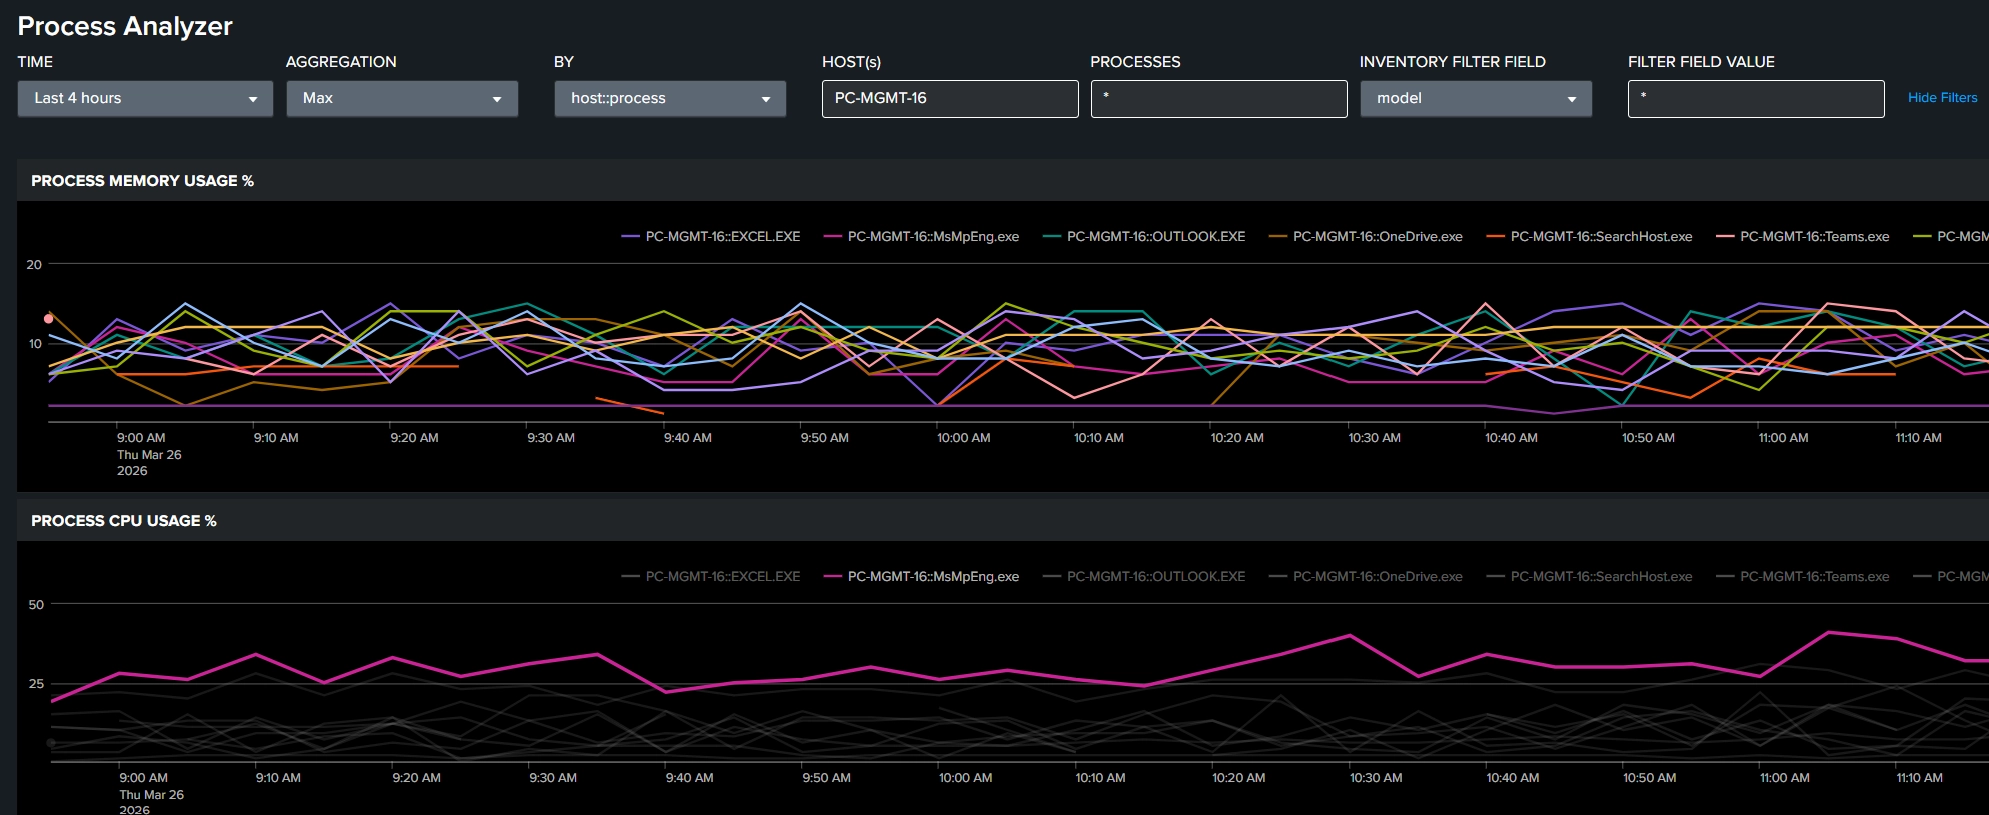
📊 Performance & health, the essentials
- CPU, memory, GPU, disk latency, network usage
- Ping latency & packet loss with automatic target detection (gateway or nearest domain controller)
- Wi-Fi signal quality
- Battery drain & health — discharge rate (mWh/h, %/h) and estimated runtime, for laptop fleets that actually leave the desk
🧭 Context & inventory
- Top-N resource-consuming processes + configurable watchlists
- Full hardware & OS inventory: network config (IP, MAC, DNS, SSID), AD / Entra ID / Intune / MDM status
- Security posture (BitLocker, Defender, Firewall) and Windows health (updates, boot time, GPO)
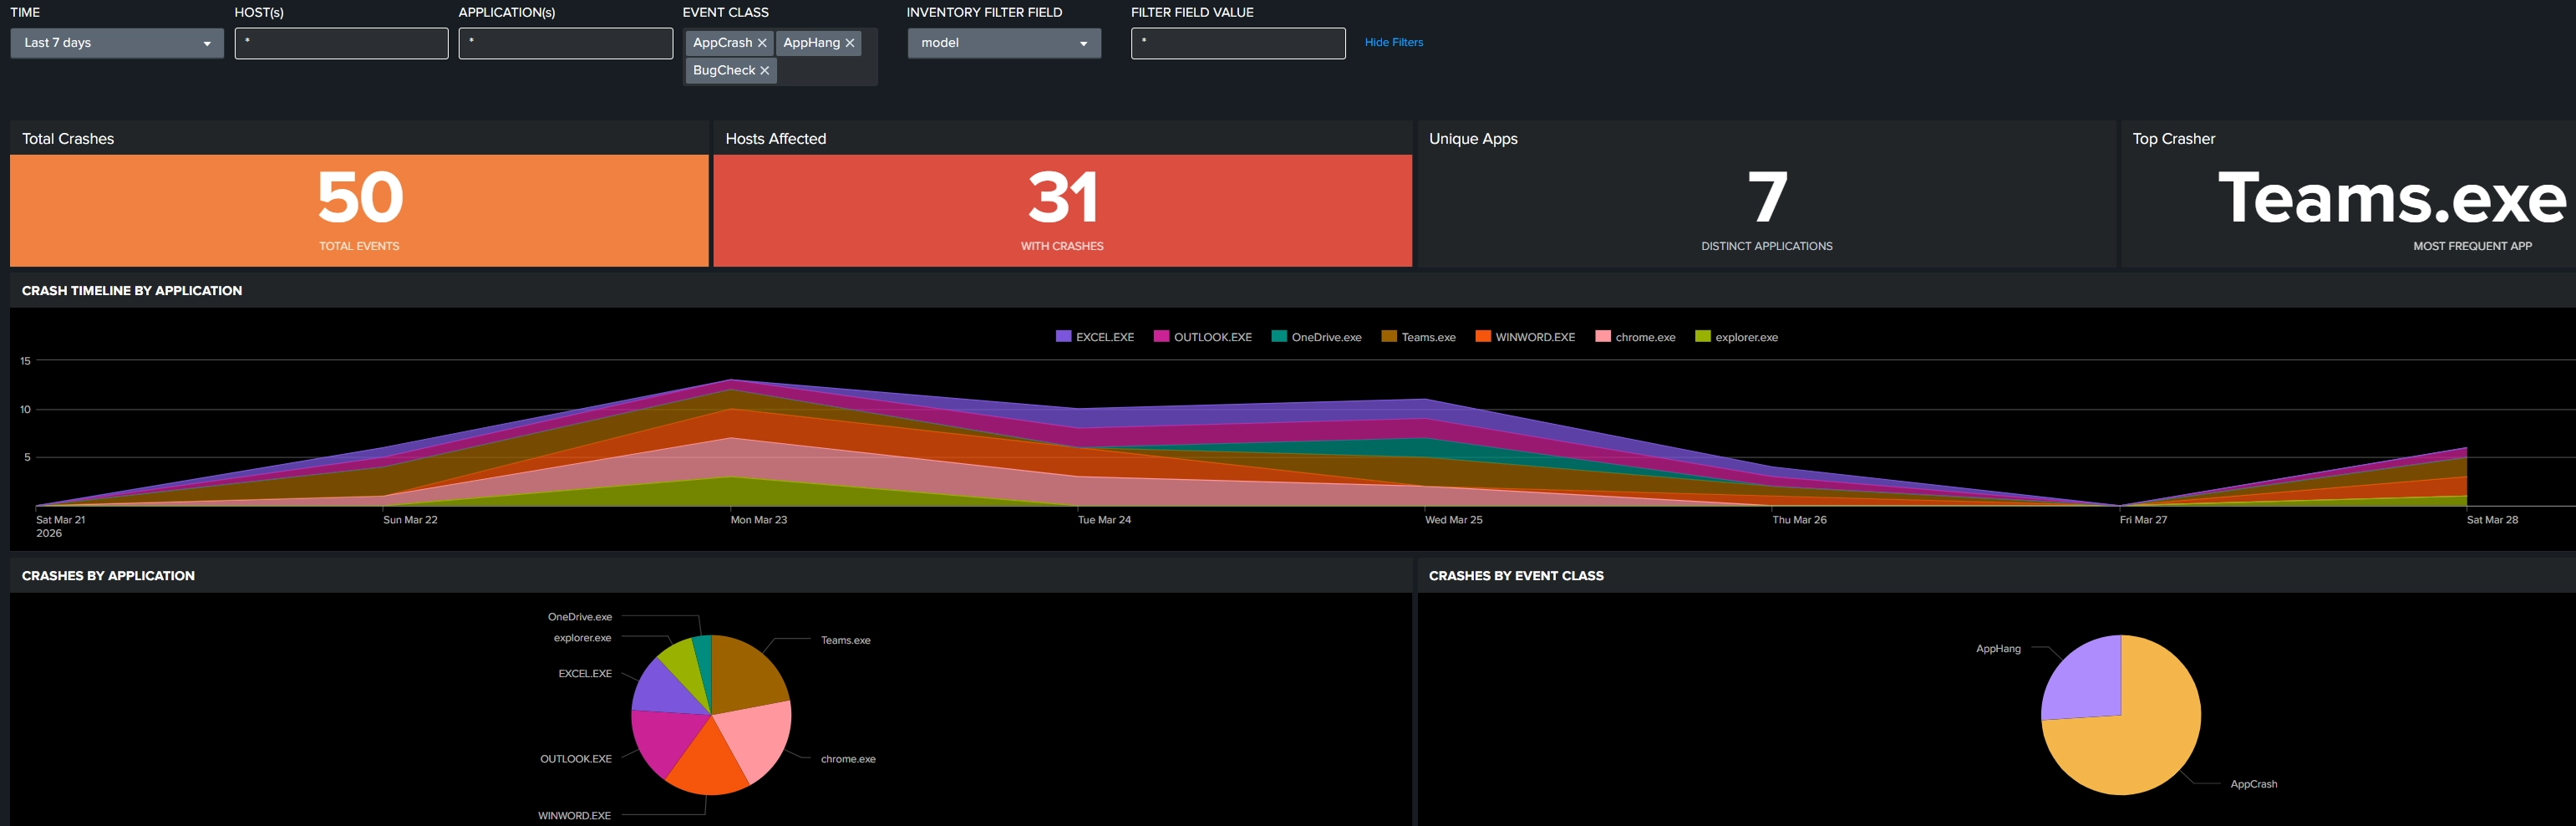
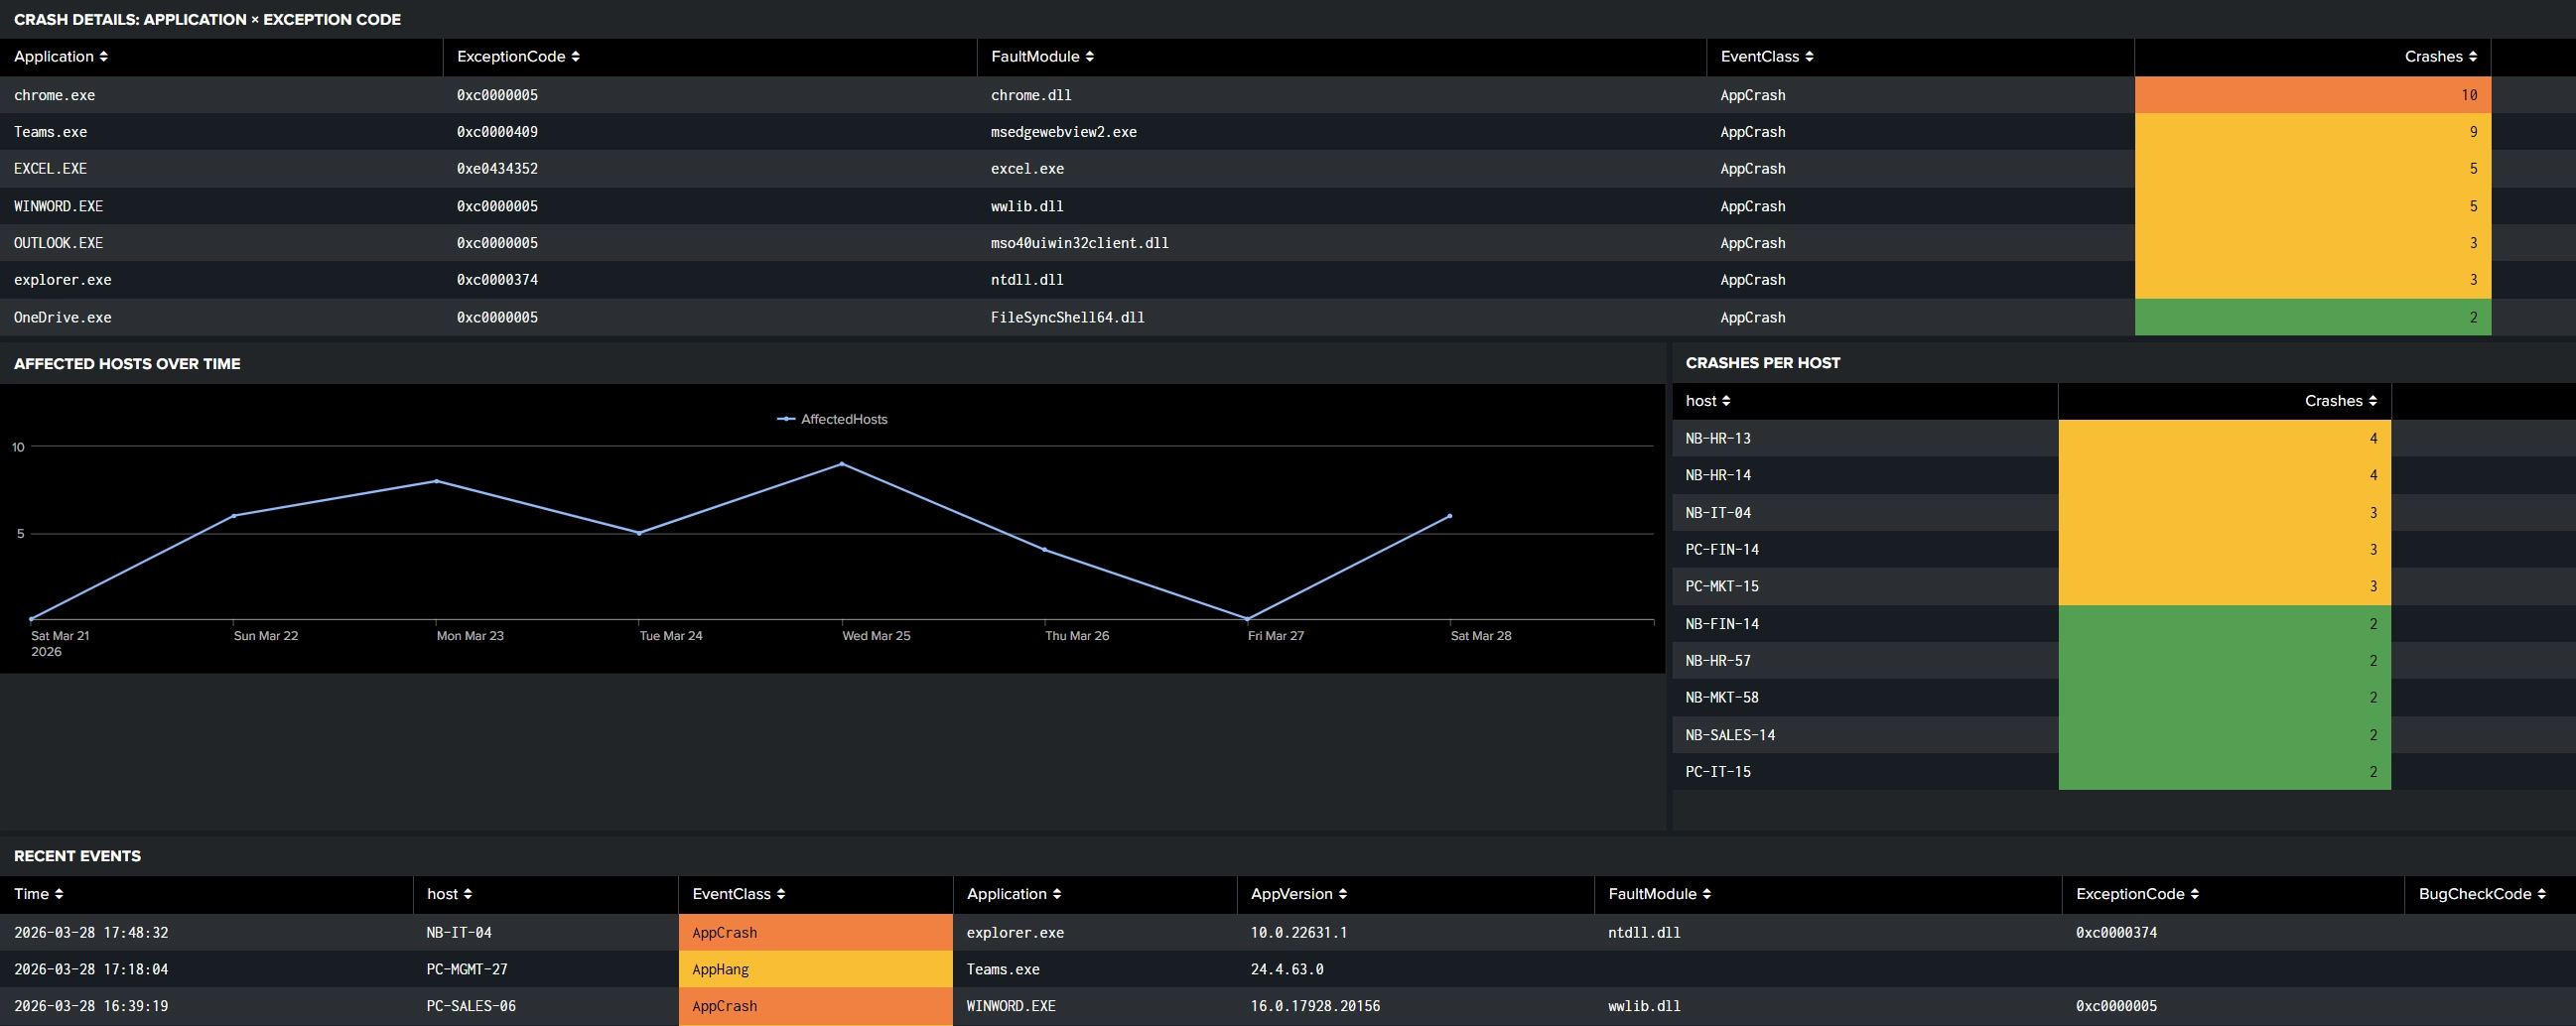
- Application crashes, hangs and Blue Screens (BSOD)
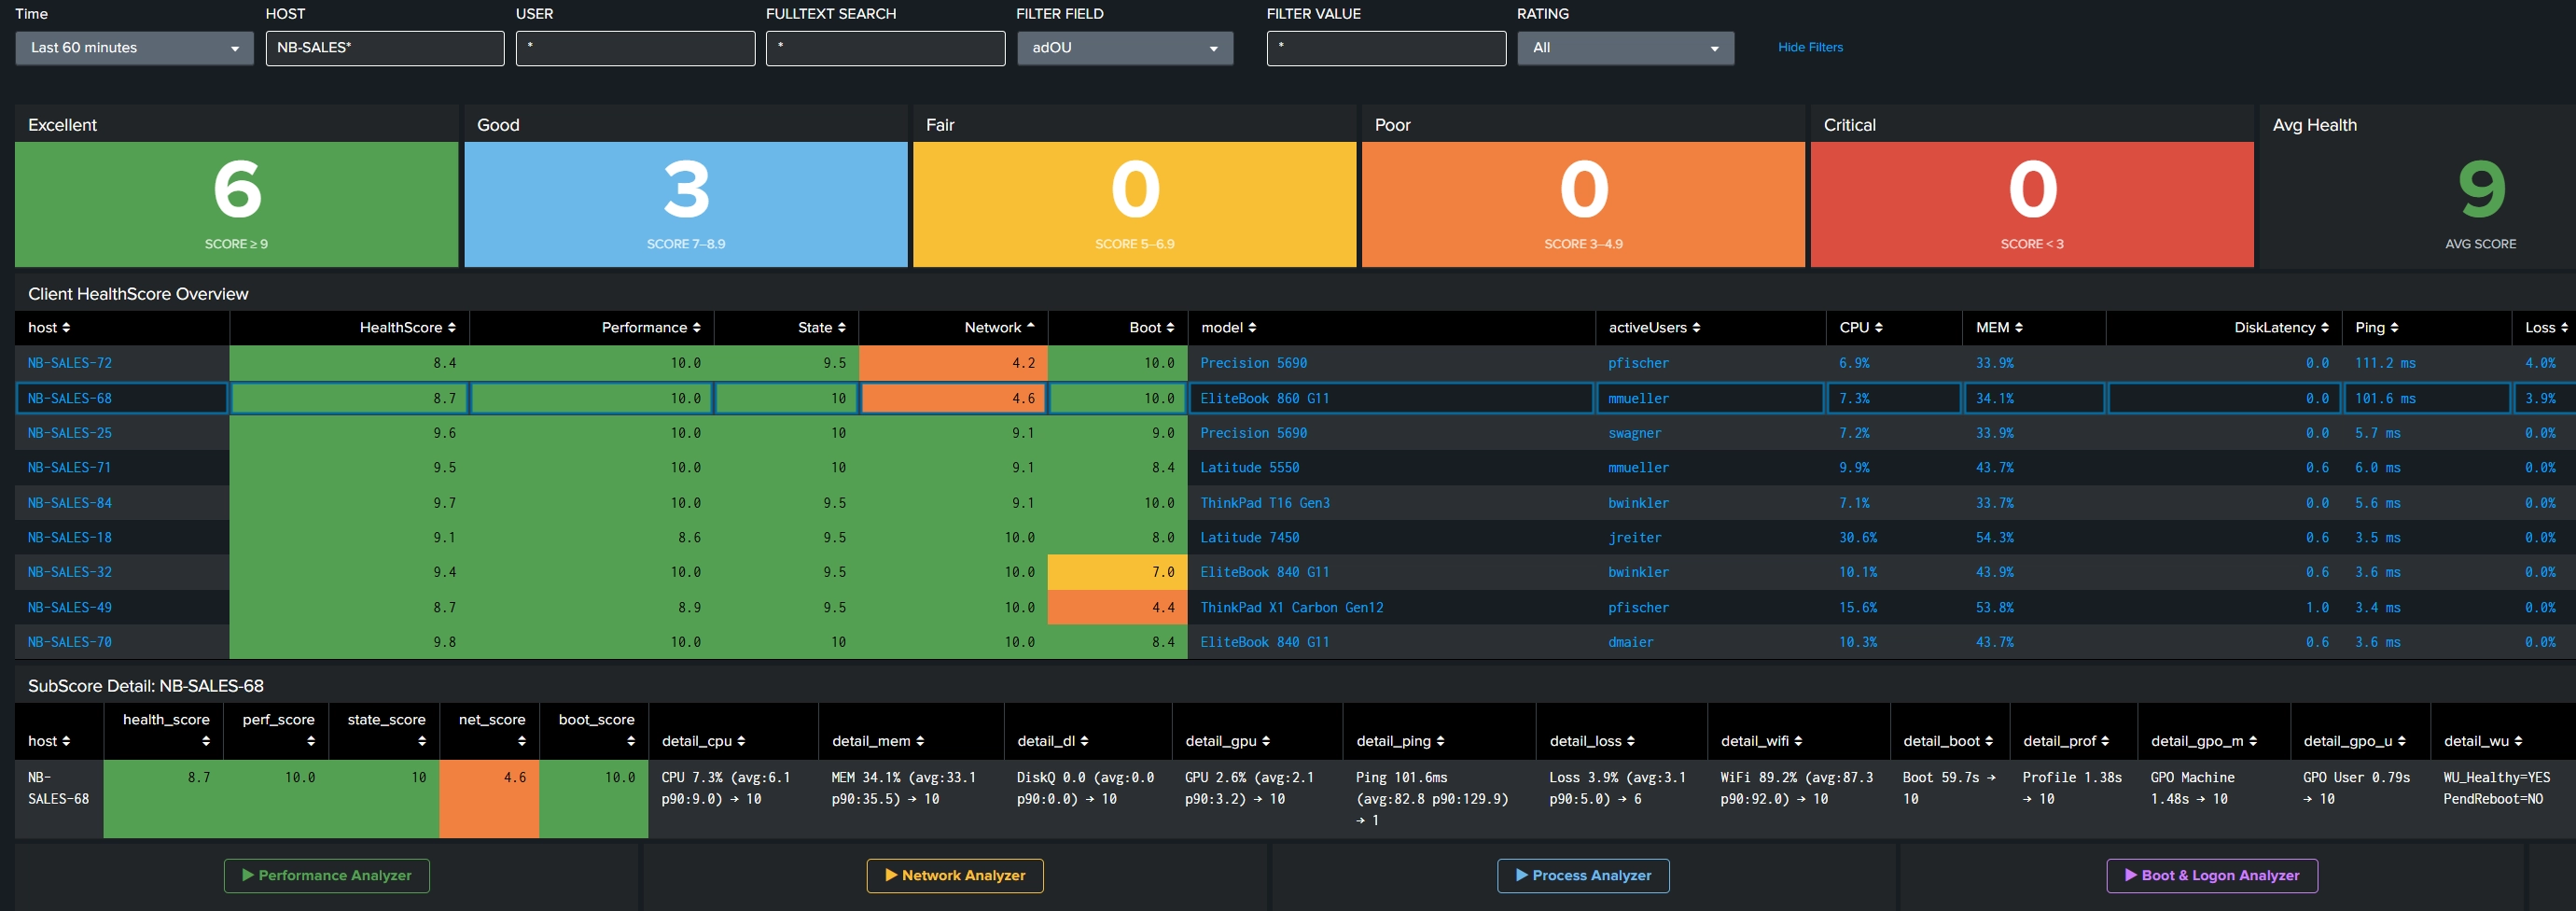
🎯 One score, fast triage
- Unified Health Score (0–10) per endpoint with Performance / System / Network / Boot subscores
- Spot degraded endpoints at a glance, then drill straight into root-cause metrics
💸 Why it's different
- A fraction of the cost of typical EUXM/DEX platforms
- Threshold-based collection — only meaningful data leaves the endpoint, keeping ingest low
- Up and running in minutes
⚙️ Deployment
- Agentless via Scheduled Task + HEC, or Splunk Universal Forwarder (scripted input)
For demo, PoV, or integration support: 📩 splunkbase@itdesign.at