This Splunk app provides two prebuilt Dashboard Studio dashboards for monitoring and analyzing Hitachi VSP One Block storage arrays. It visualizes configuration and performance data collected by the companion VSP One Block Add-on via the VSP 360 REST API.
It helps administrators monitor fleet-level storage KPIs at a glance, track pool capacity trends and subscription rates over time, analyze array-level IOPS, transfer rates, and cache utilization, identify top LDEV performers by IOPS, response time, and transfer rate, monitor pool and parity group performance trends, and correlate port throughput and processor utilization across arrays.
Dashboards included:
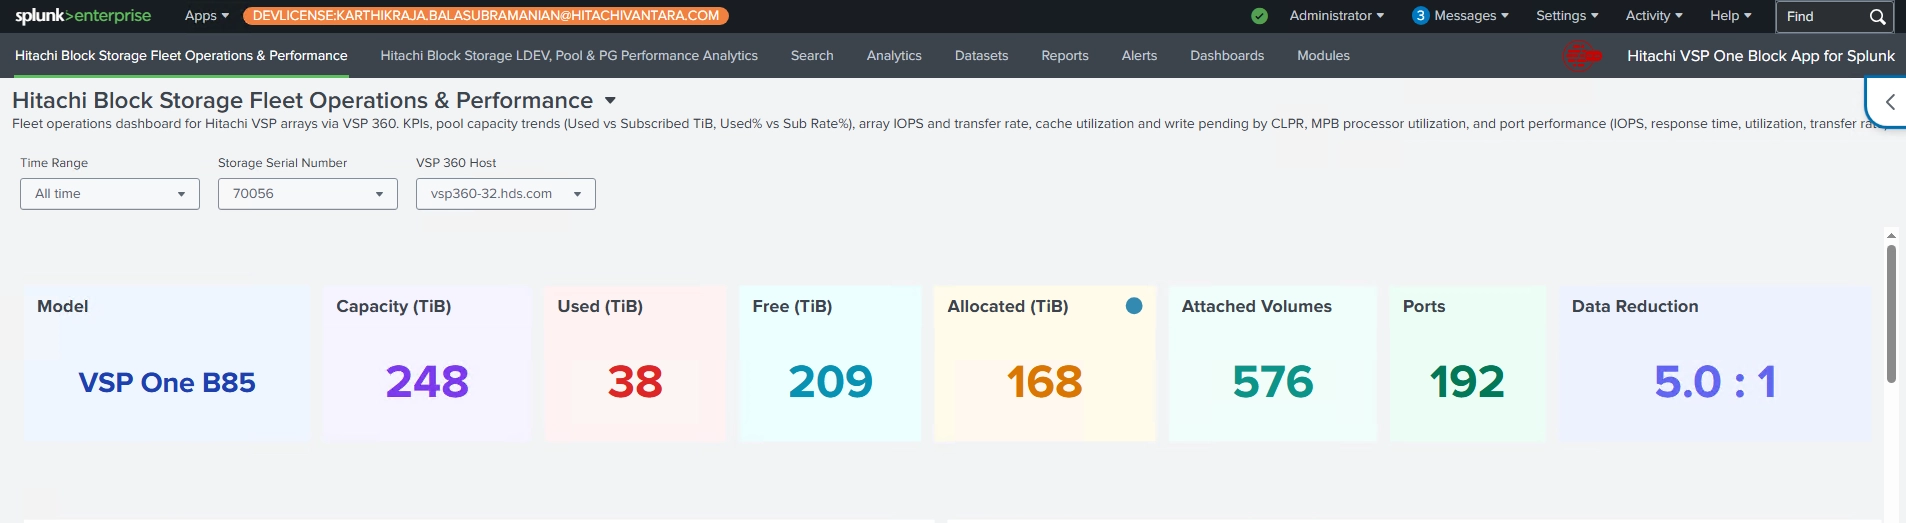
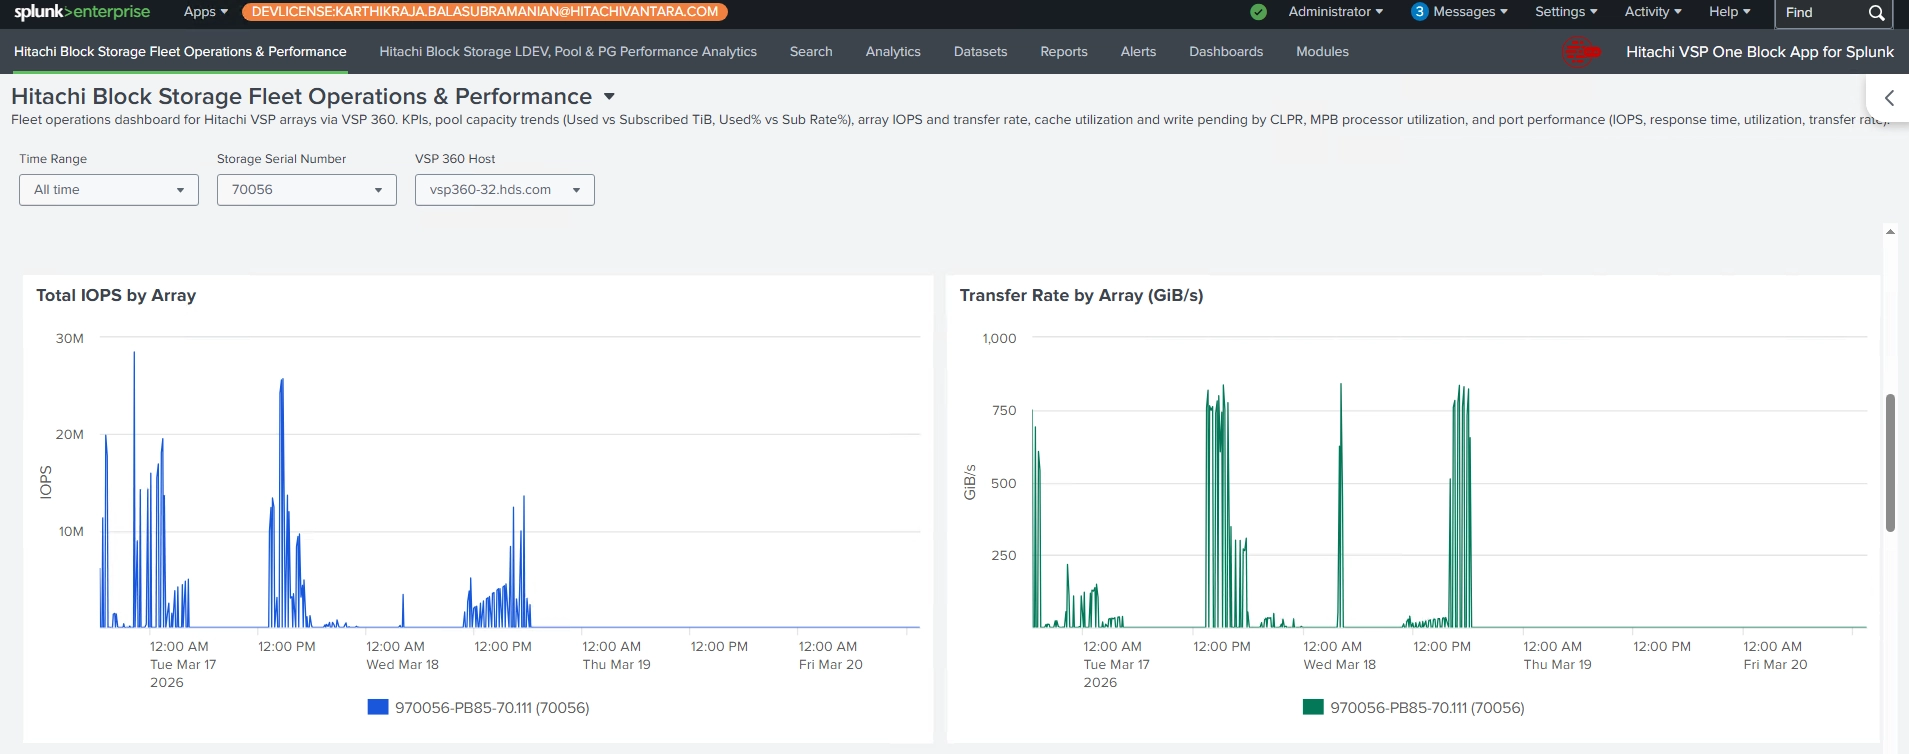
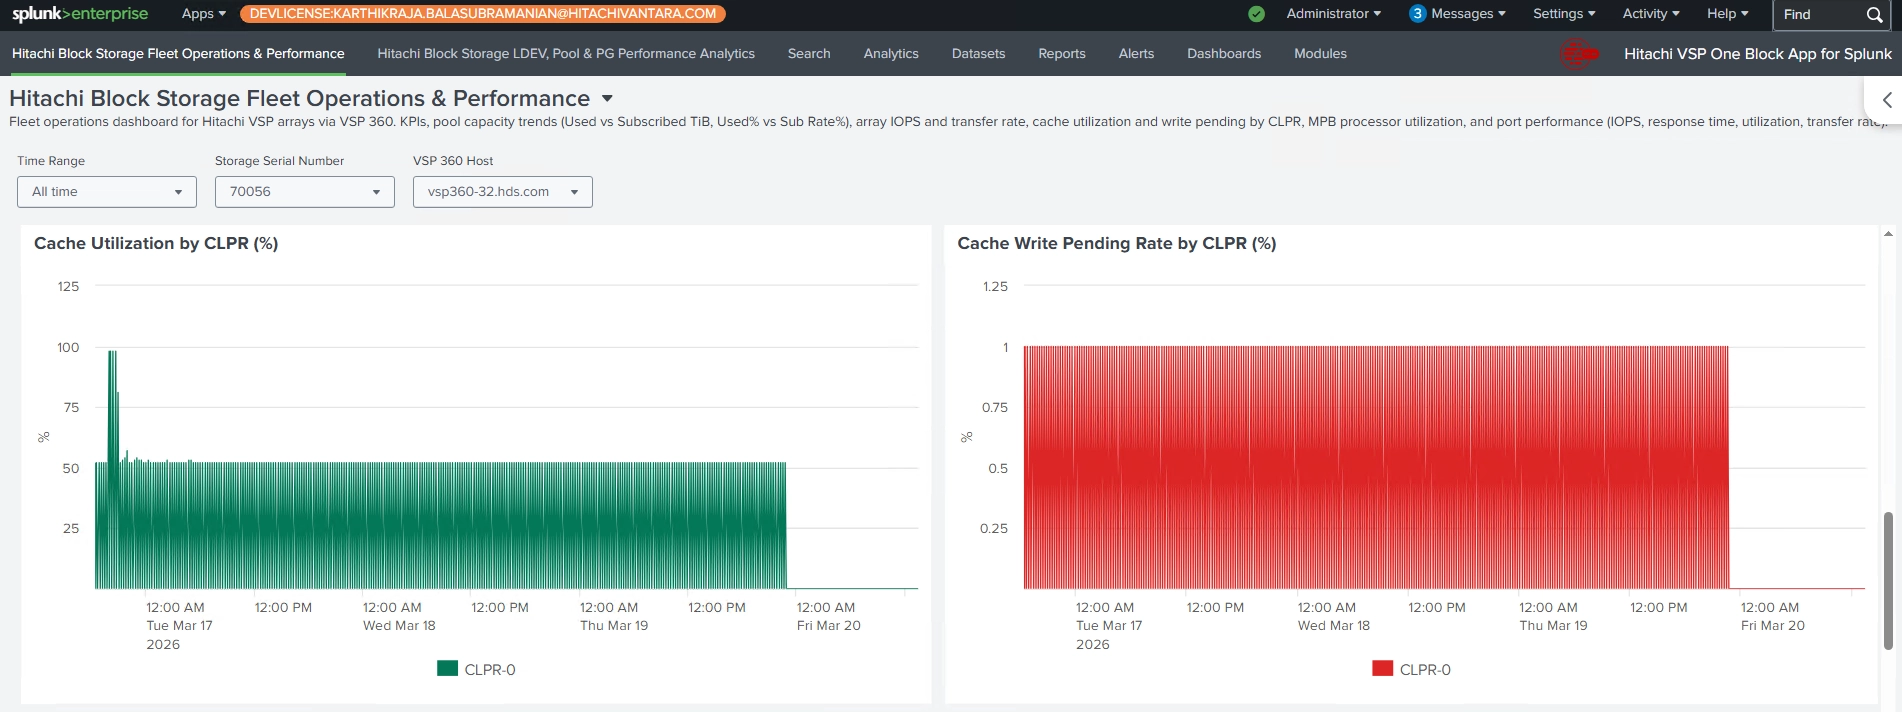
Fleet Operations & Performance: Storage system KPI tiles (capacity, used, free, allocated TiB, data reduction ratio, volume and port counts), pool capacity trend lines (Used vs Subscribed TiB, Used% vs Subscription Rate%), array-level IOPS and transfer rate, cache utilization and write pending by CLPR, MPB processor utilization, and port performance (IOPS, response time, utilization, transfer rate).
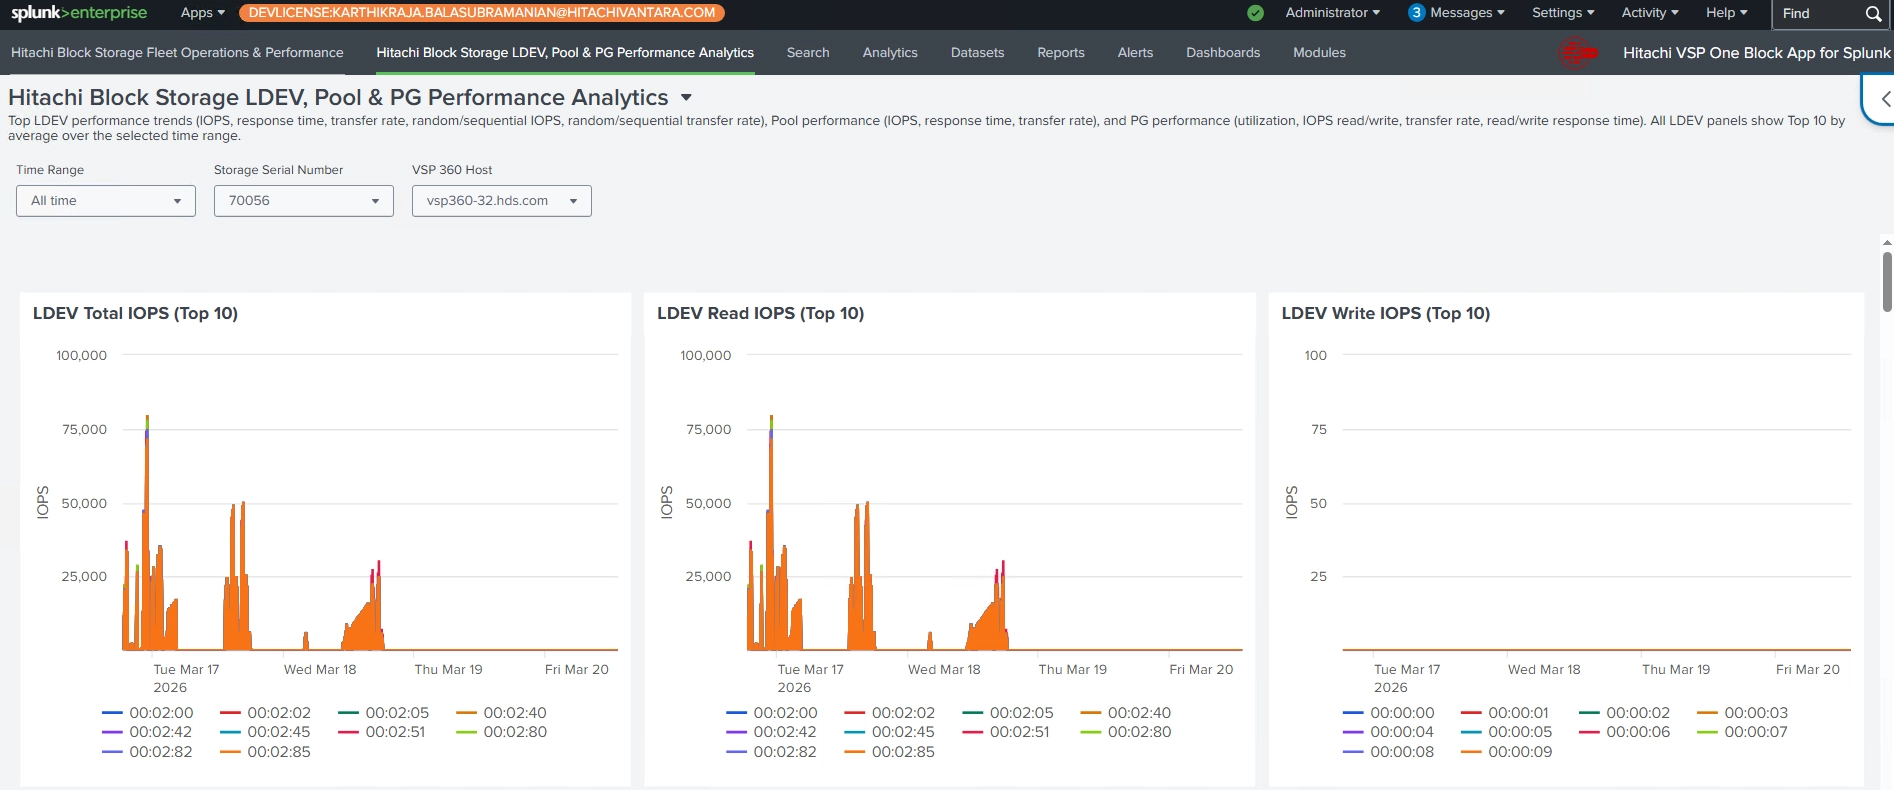
LDEV, Pool & PG Performance Analytics: Top 10 LDEV IOPS (total, read, write), Top 10 LDEV response time (total, read, write), Top 10 LDEV transfer rate (total, read, write), Top 10 LDEV random IOPS and transfer rate (read, write), Top 10 LDEV sequential IOPS and transfer rate (read, write), pool IOPS, response time, and transfer rate, and parity group utilization, IOPS, transfer rate, and response time.
Data source: This app requires the VSP One Block Add-on via VSP 360 to collect data. The add-on indexes events into Splunk using three sourcetypes: hitachi:vspblock:config (configuration attributes), hitachi:vspblock:perf (performance timeseries), and hitachi:vspblock:synth (synthetic roll-up metrics). All dashboards query the hitachicsad index by default.