Default Version 1.0.0
August 15, 2025
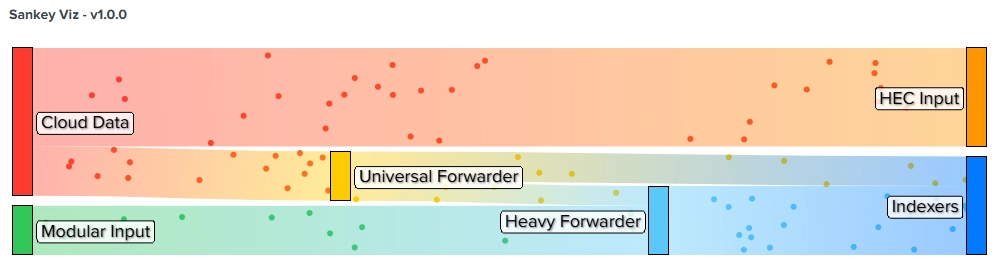
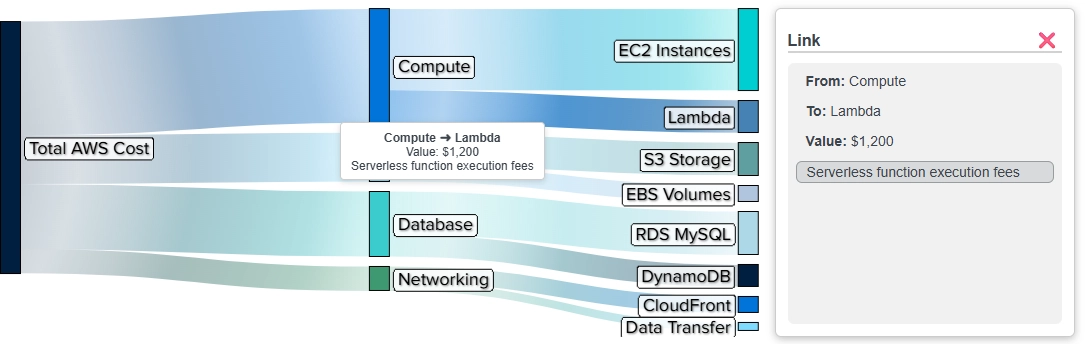
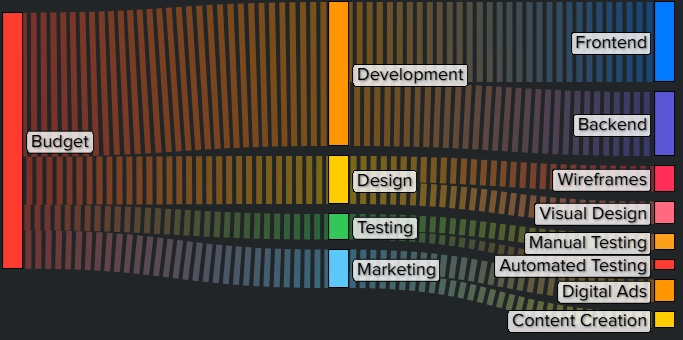
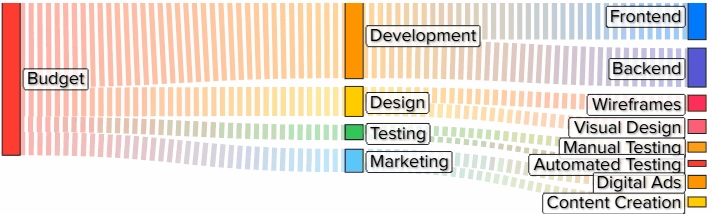
The Sankey Viz adds the ability to create Sankey diagrams to Splunk dashboards. Show metric flows and category relationships between your monitored entities. Choose color themes and add animation to make your dashboards look slick and informative.
(2)
Categories
Created By
Type
Downloads
Splunk Answers
Ask a question about this app listing(Opens new window)Resources