Default Version 1.1.1
March 31, 2026
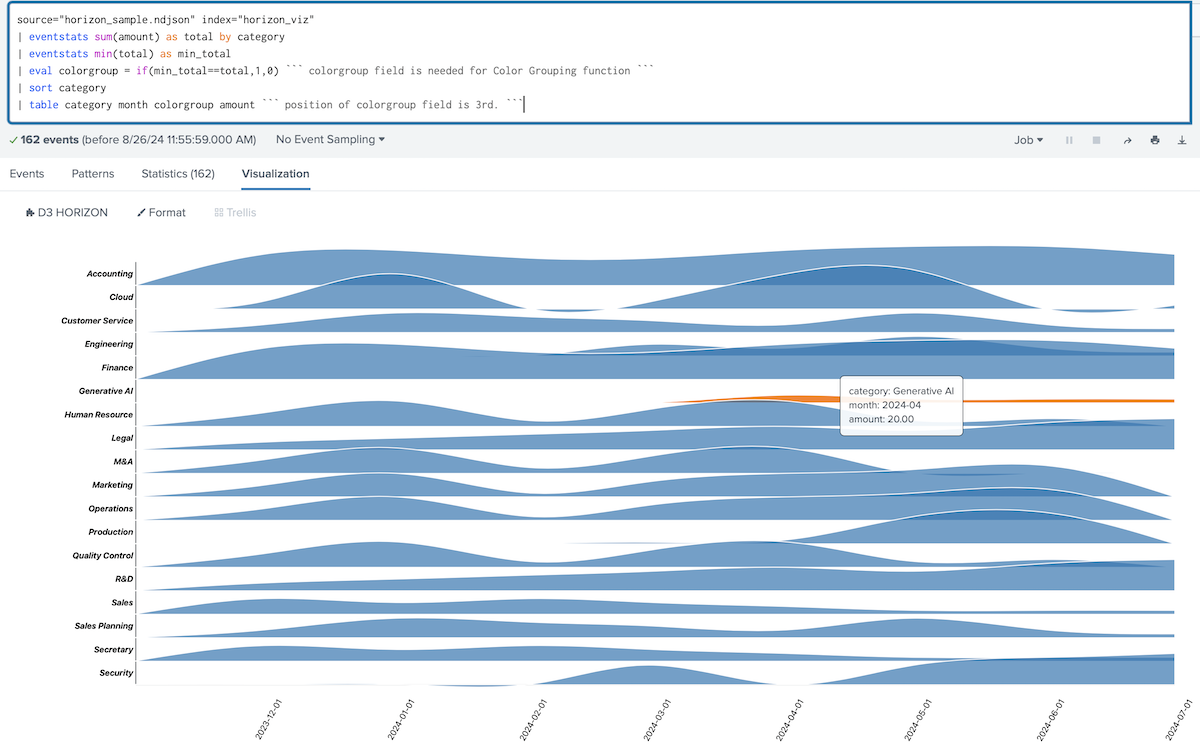
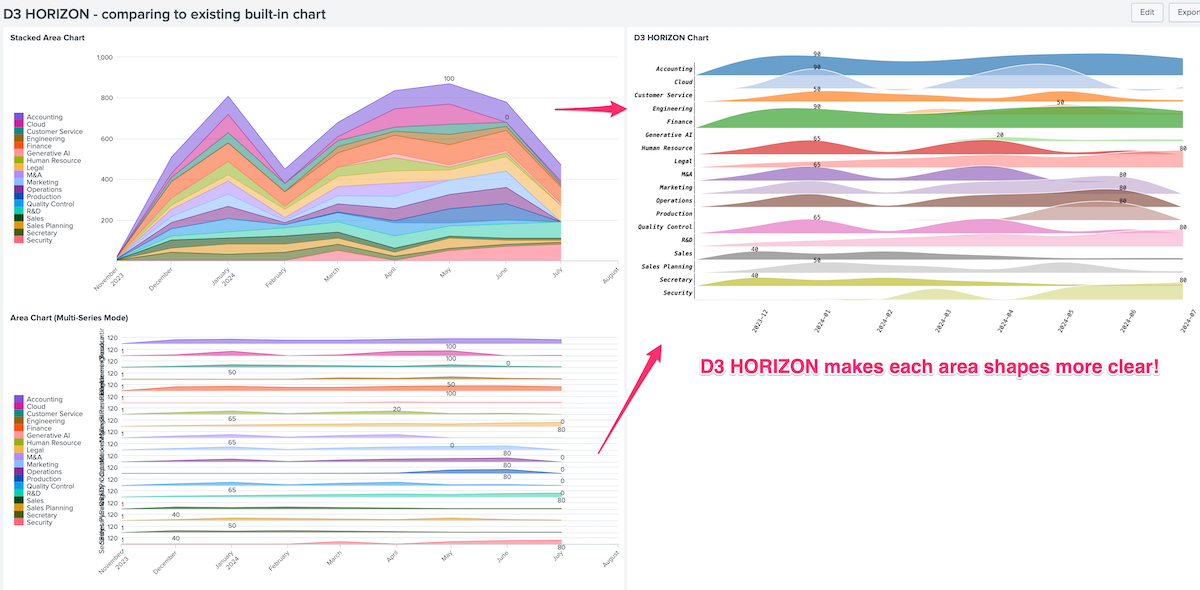
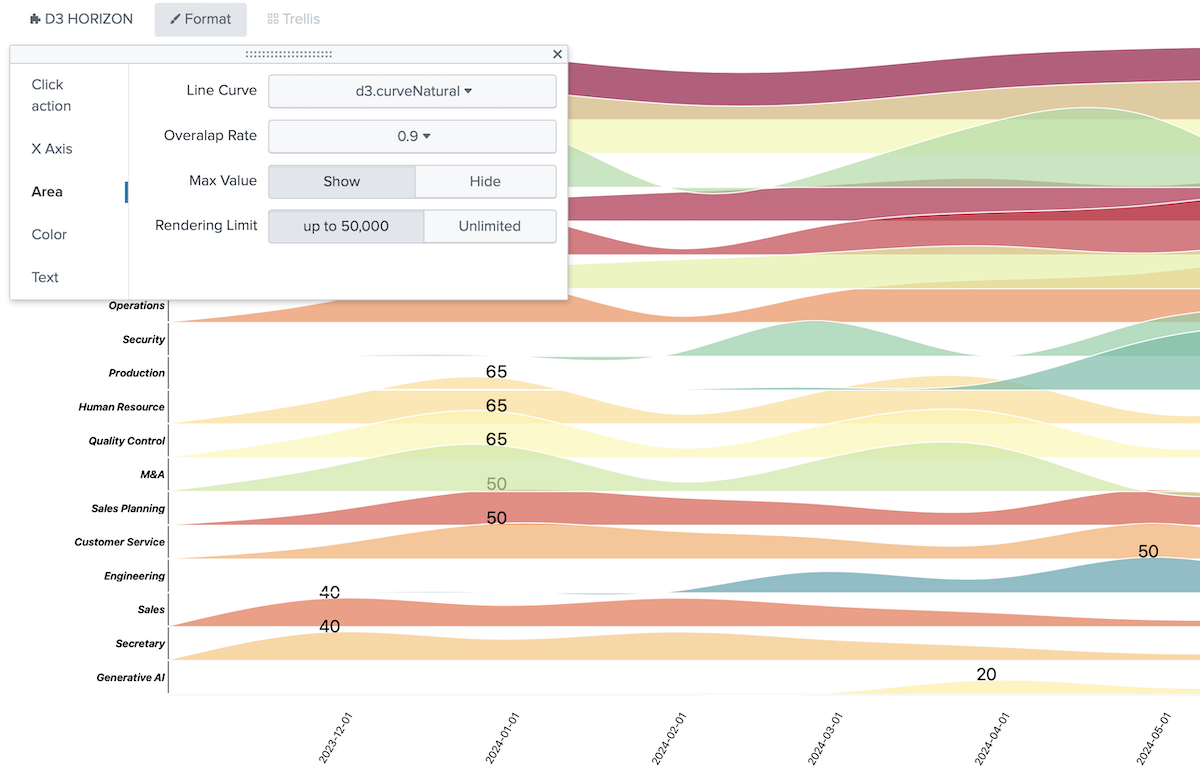
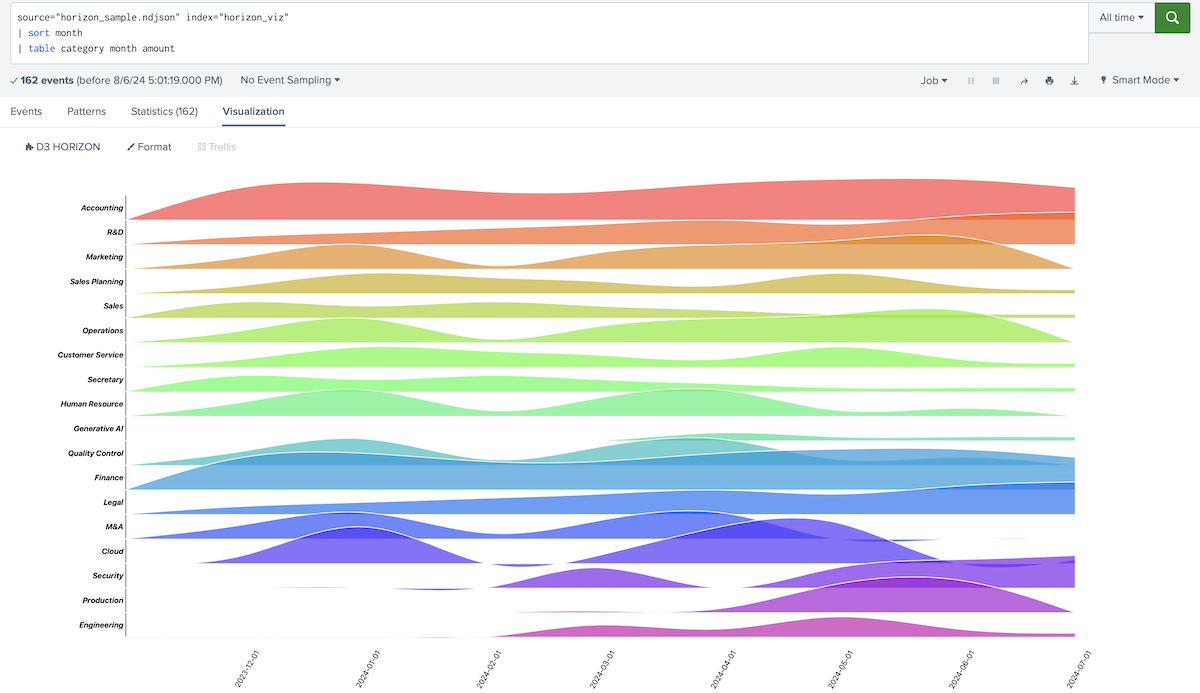
Custom visualization App to show horizon chart by using "D3.js". This horizon chart is more colorful and has overlap function of area.
(0)
Categories
Created By
Type
Downloads
Splunk Answers
Ask a question about this app listing(Opens new window)Resources