Default Version 2.5.1
June 30, 2026
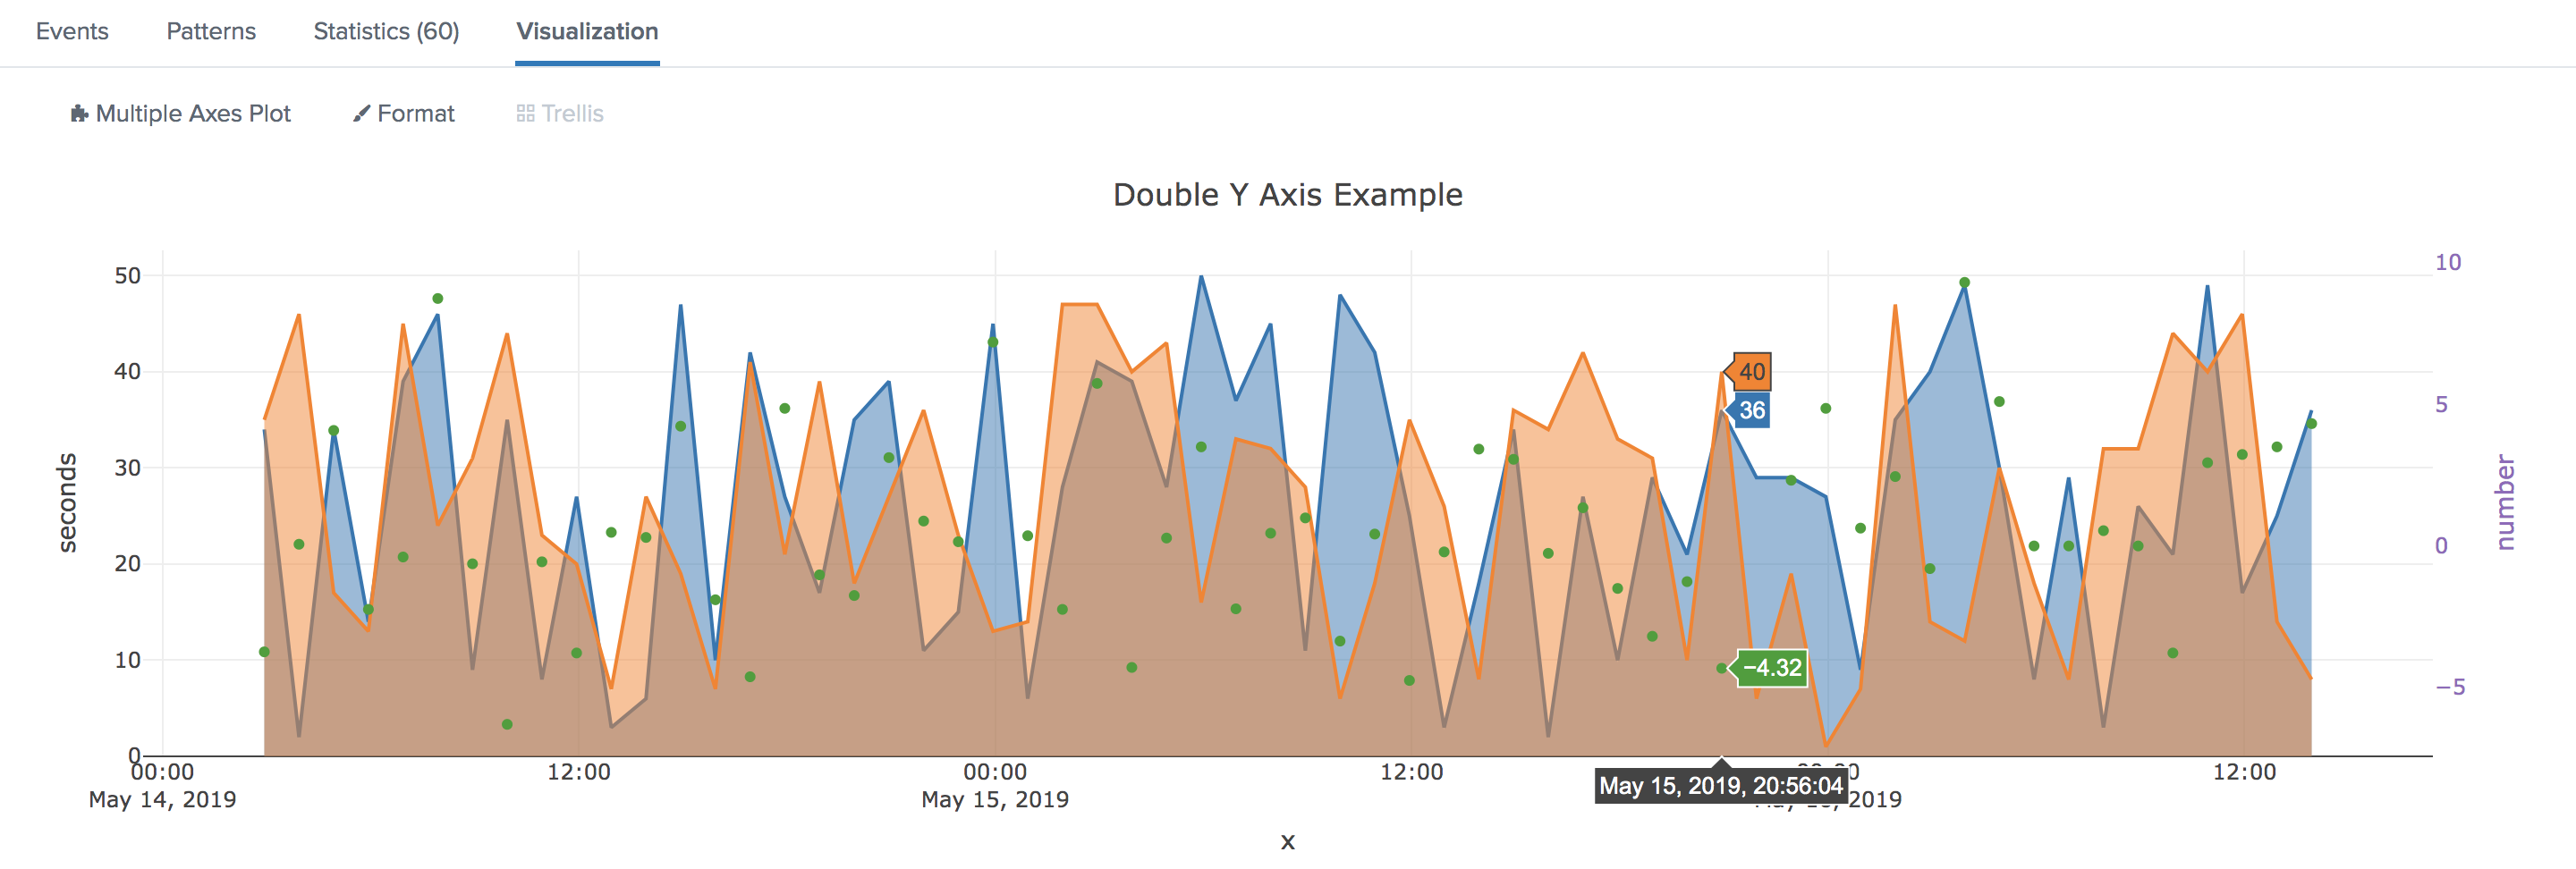
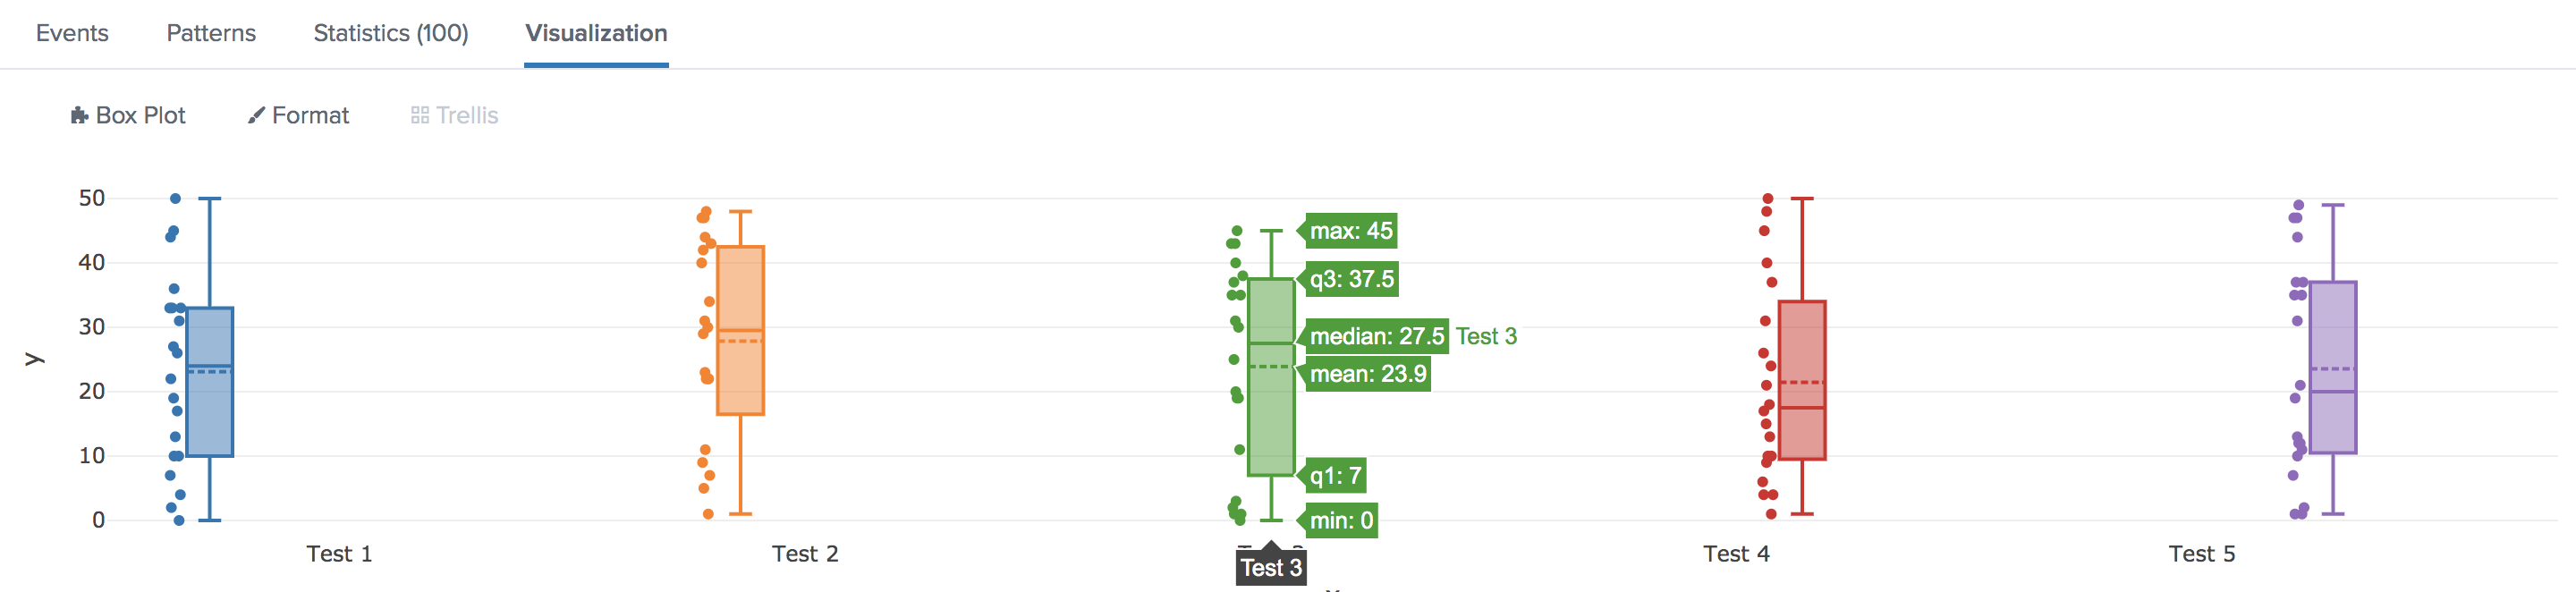
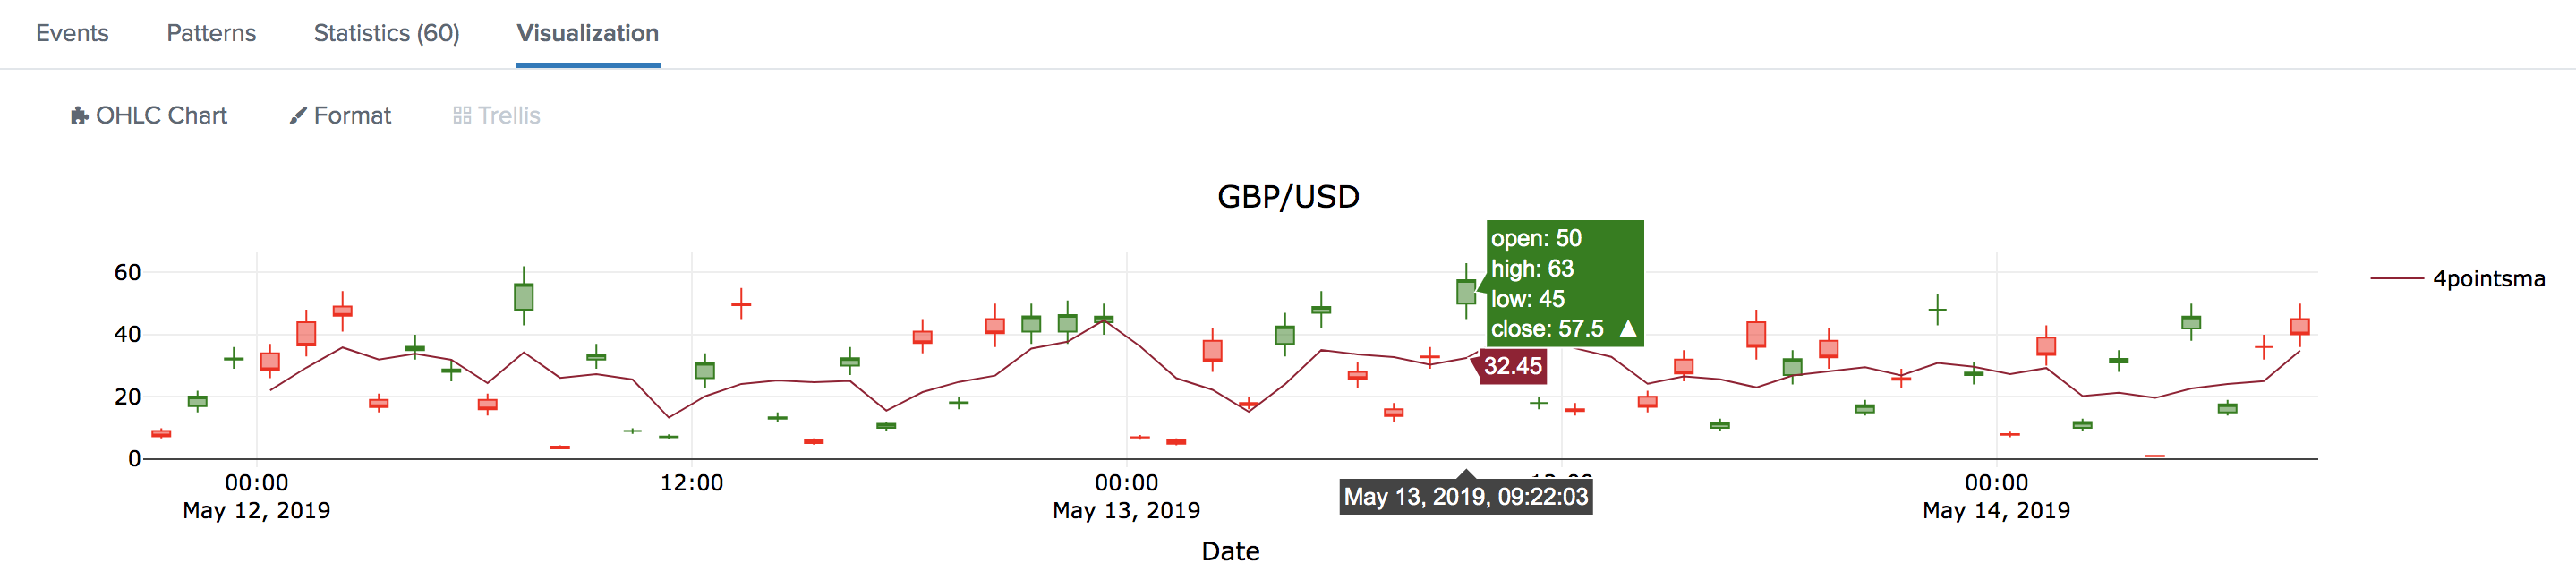
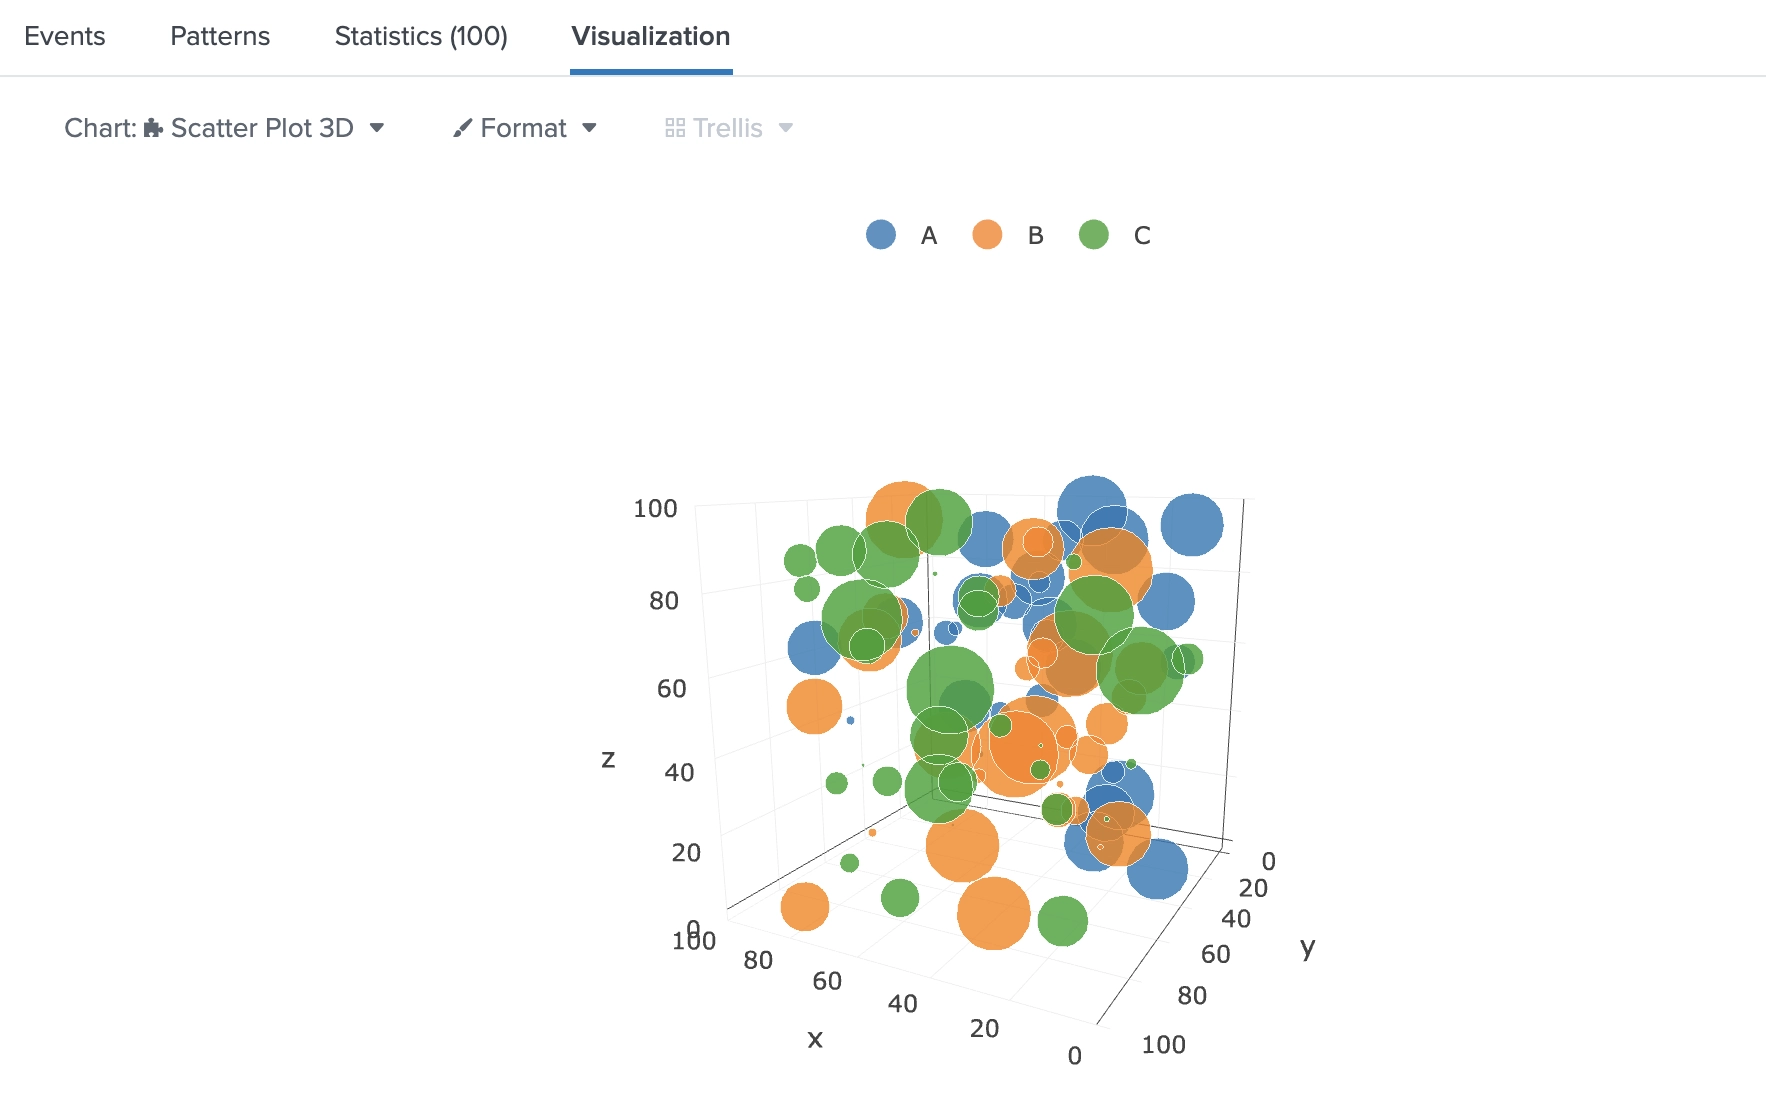
This app provides a collection of custom visualizations based on Plotly.js, a JavaScript open-source library used to create interactive charts for finance, engineering and sciences.
(0)
Categories
Created By
Type
Downloads
Splunk Answers
Ask a question about this app listing(Opens new window)Resources