Last Updated
July 11, 2023
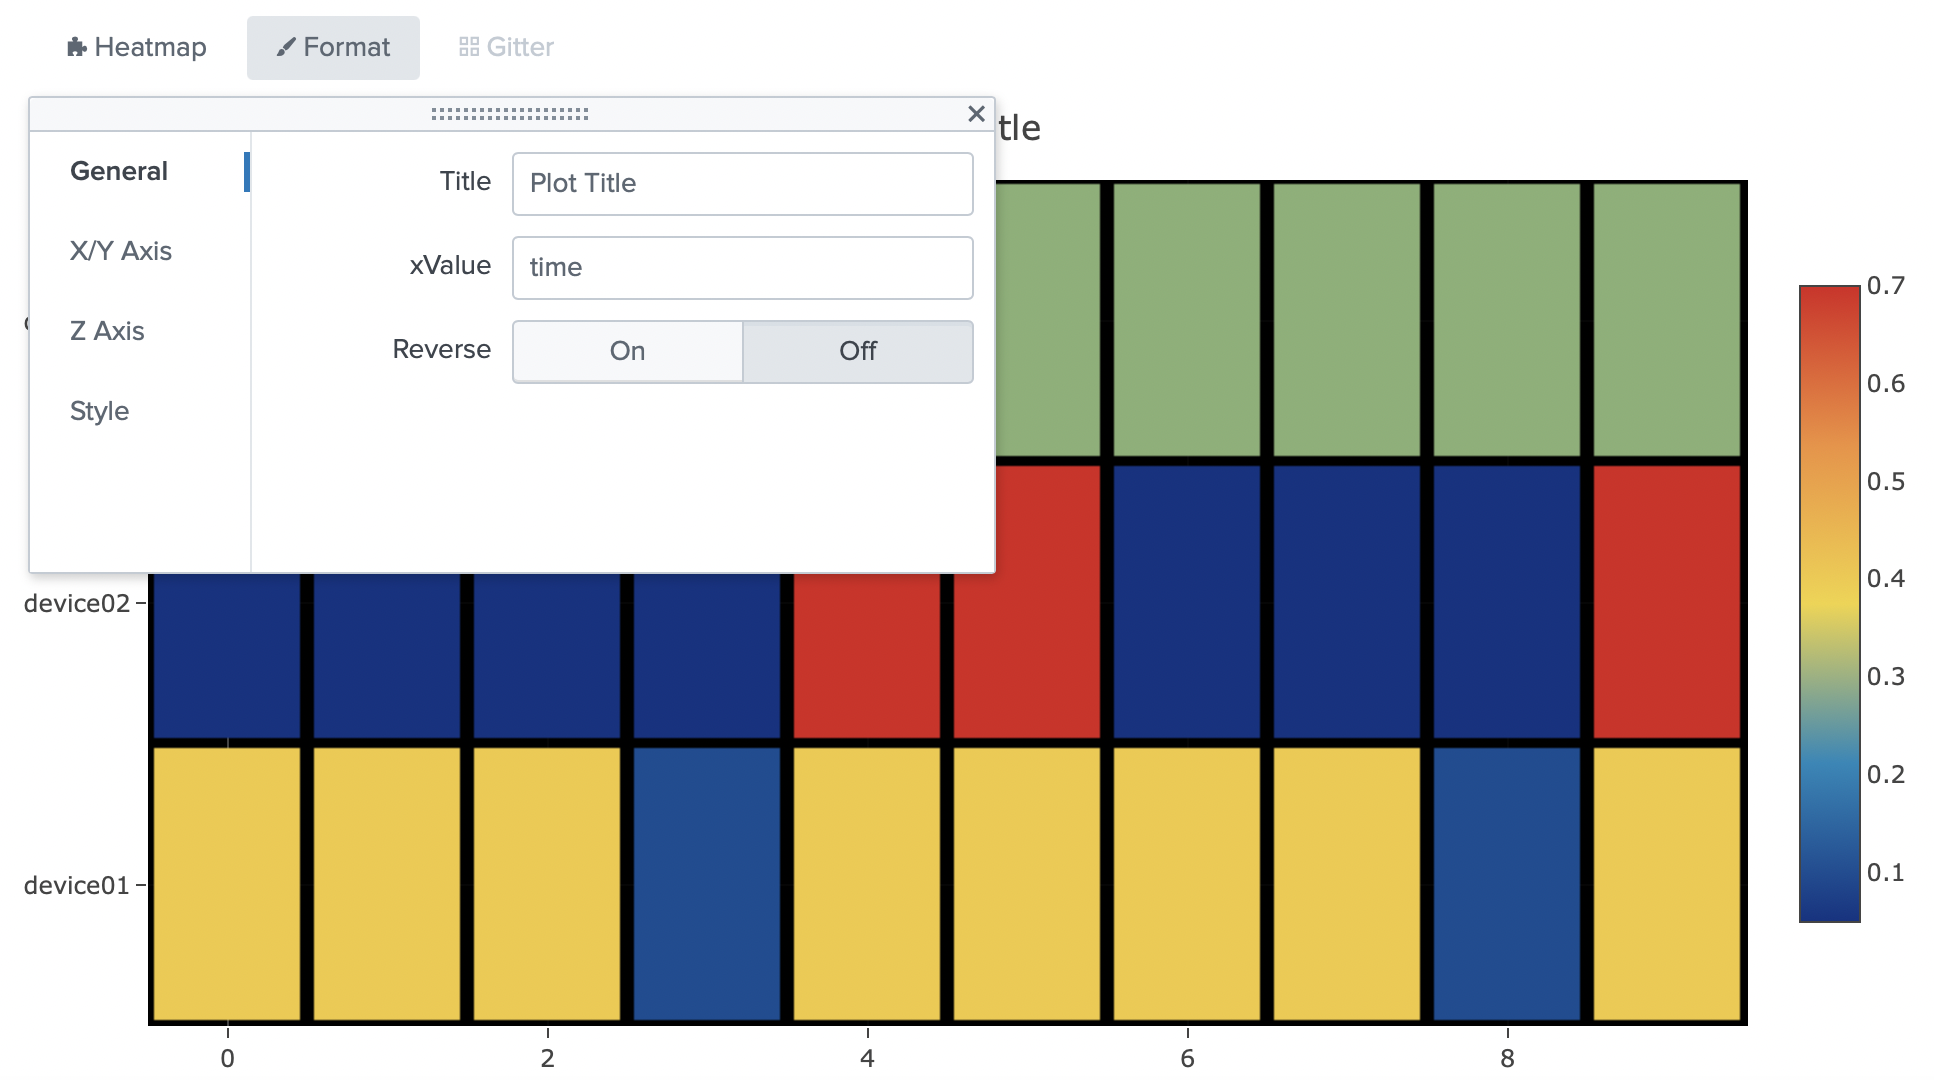
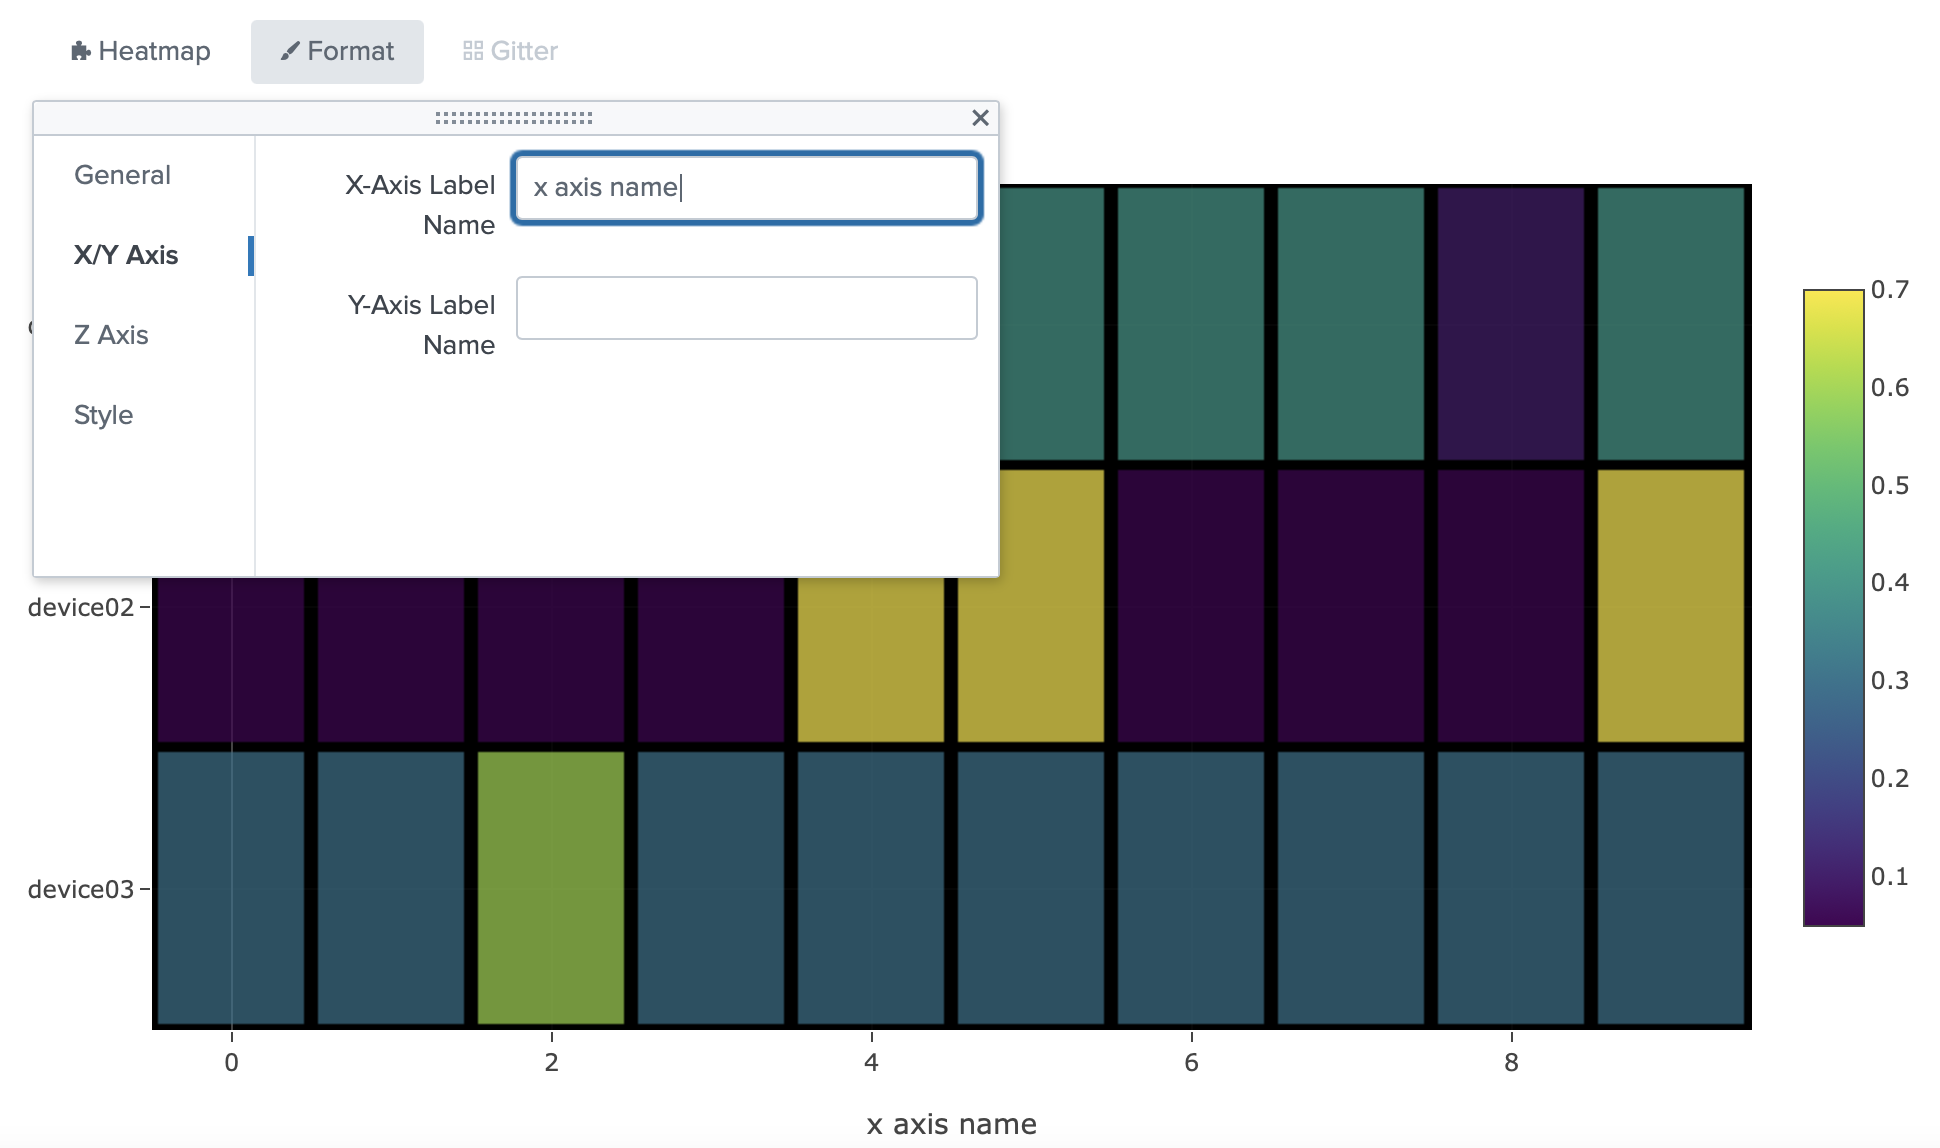
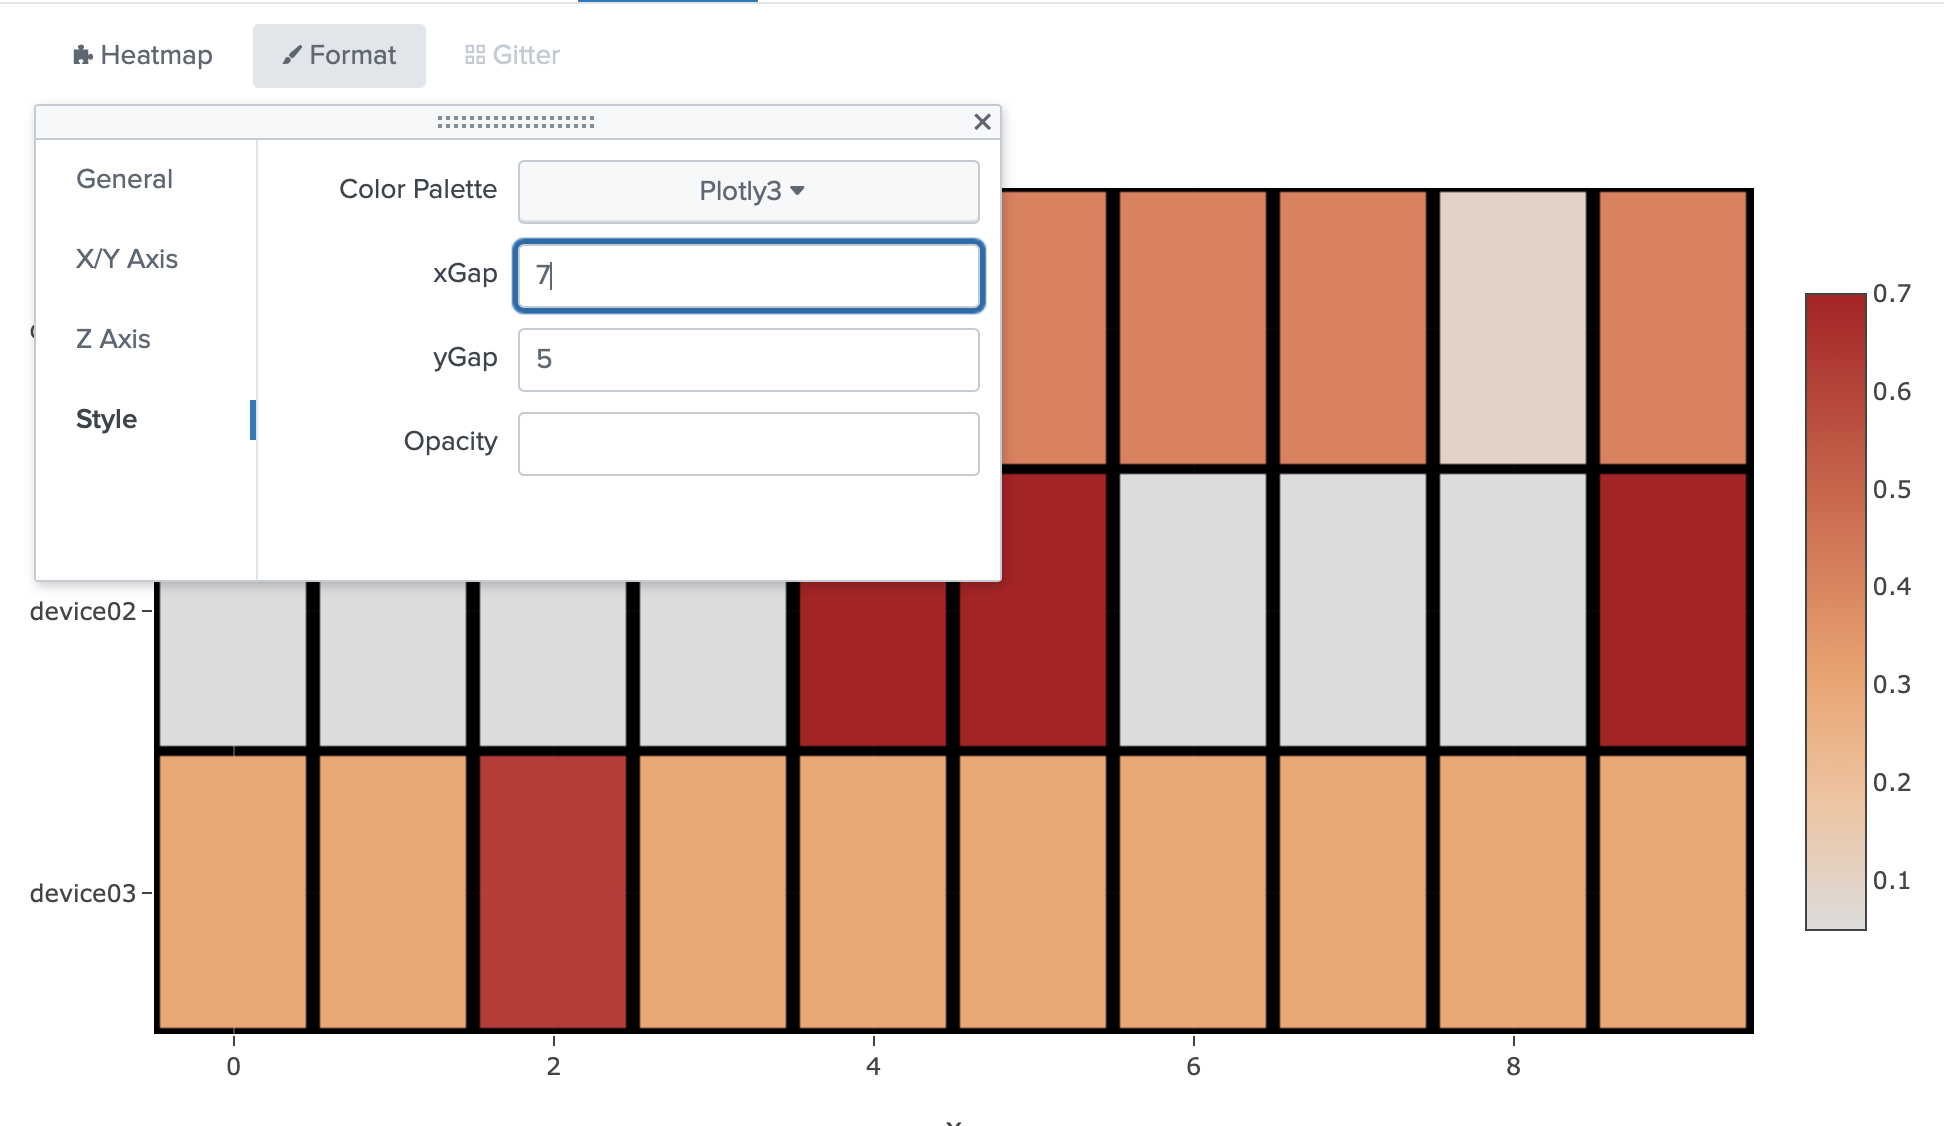
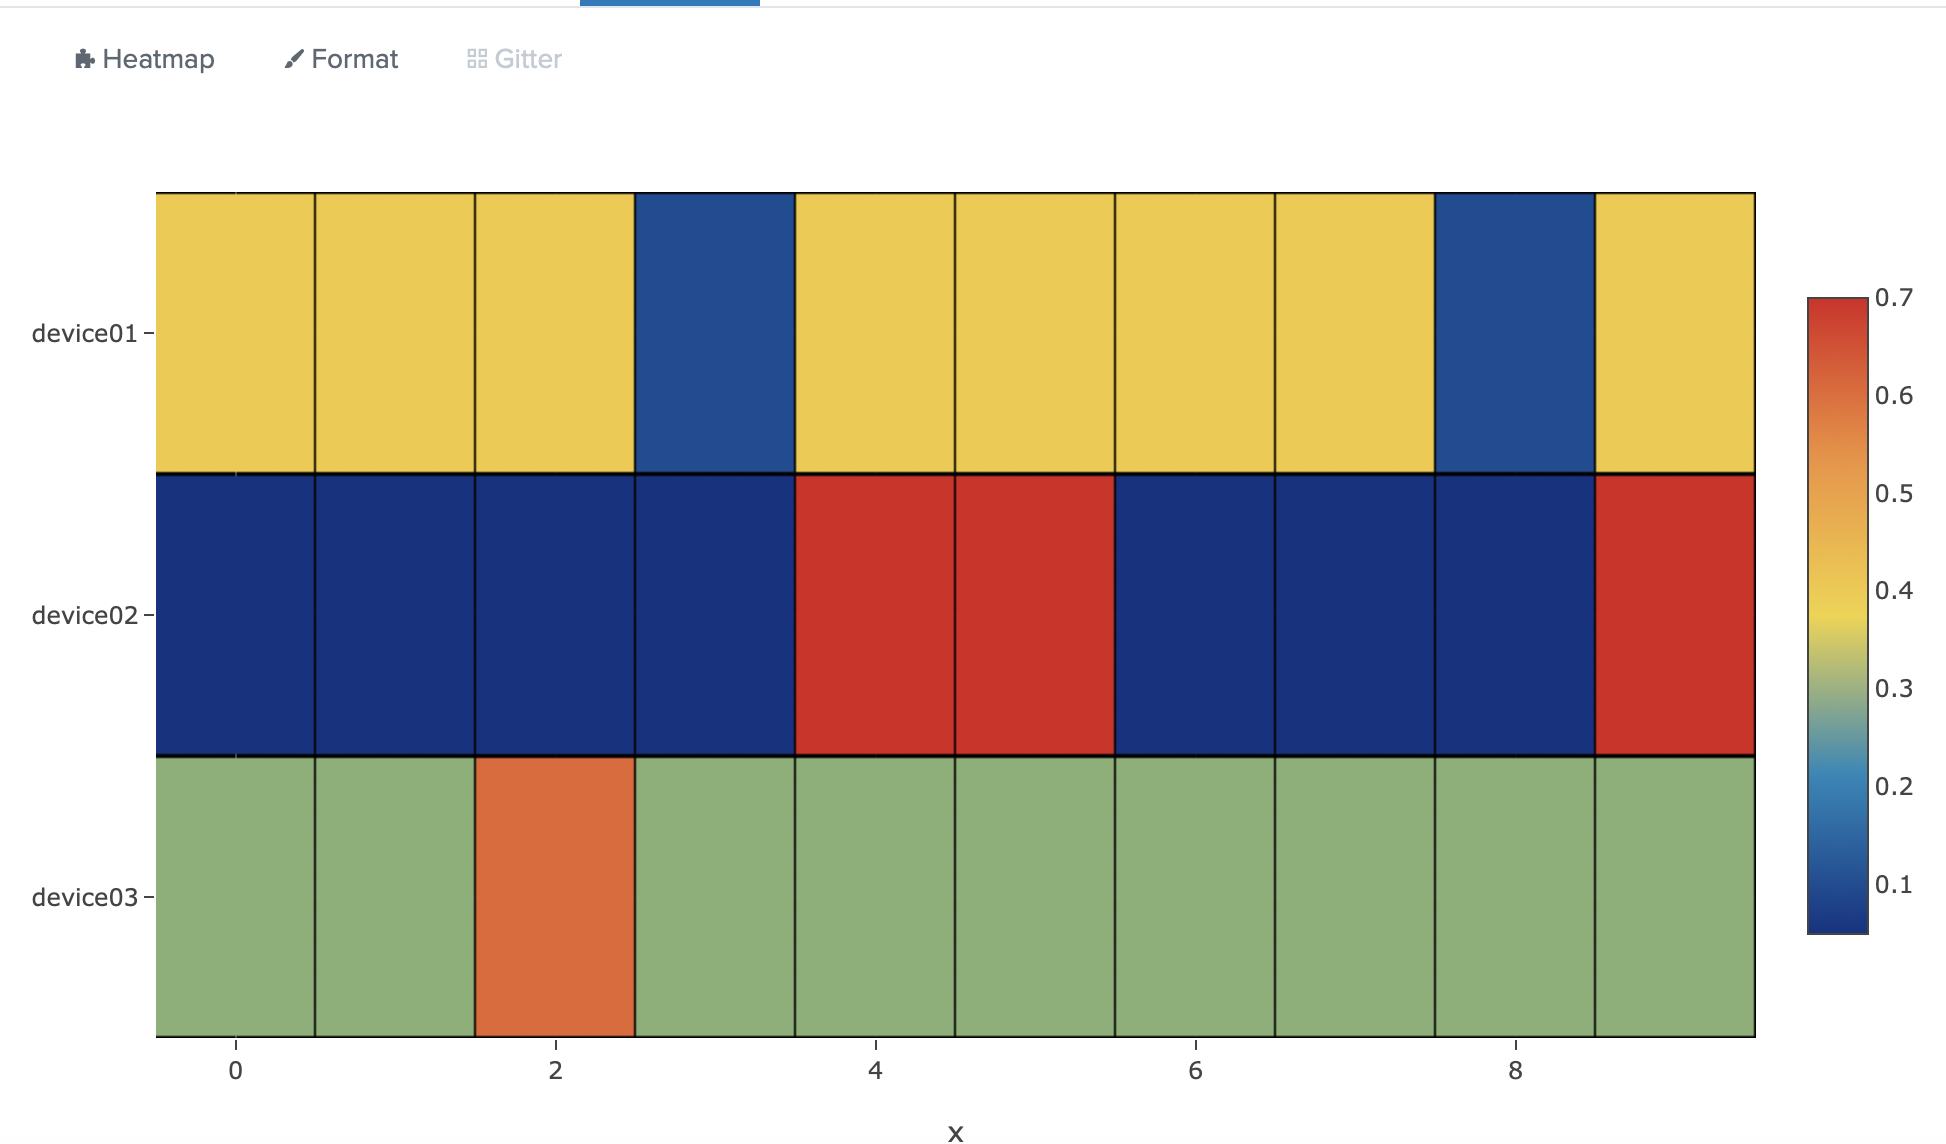
This is a custom heatmap visualization based on the "Plotly JavaScript Open Source Graphing Library". Heatmaps are useful if you want to visualize multiple metrics or statuses of different devices at the same time. We use this visualization to monitor multiple machines by visualizing the output of an anomaly detection model. The Plotly Graphing Library is good for fast rendered plots and allows for a lot of specific style configurations.
(0)
Categories
Created By
Type
Downloads
Splunk Answers
Ask a question about this app listing(Opens new window)Resources