Default Version 1.3.0
May 21, 2024
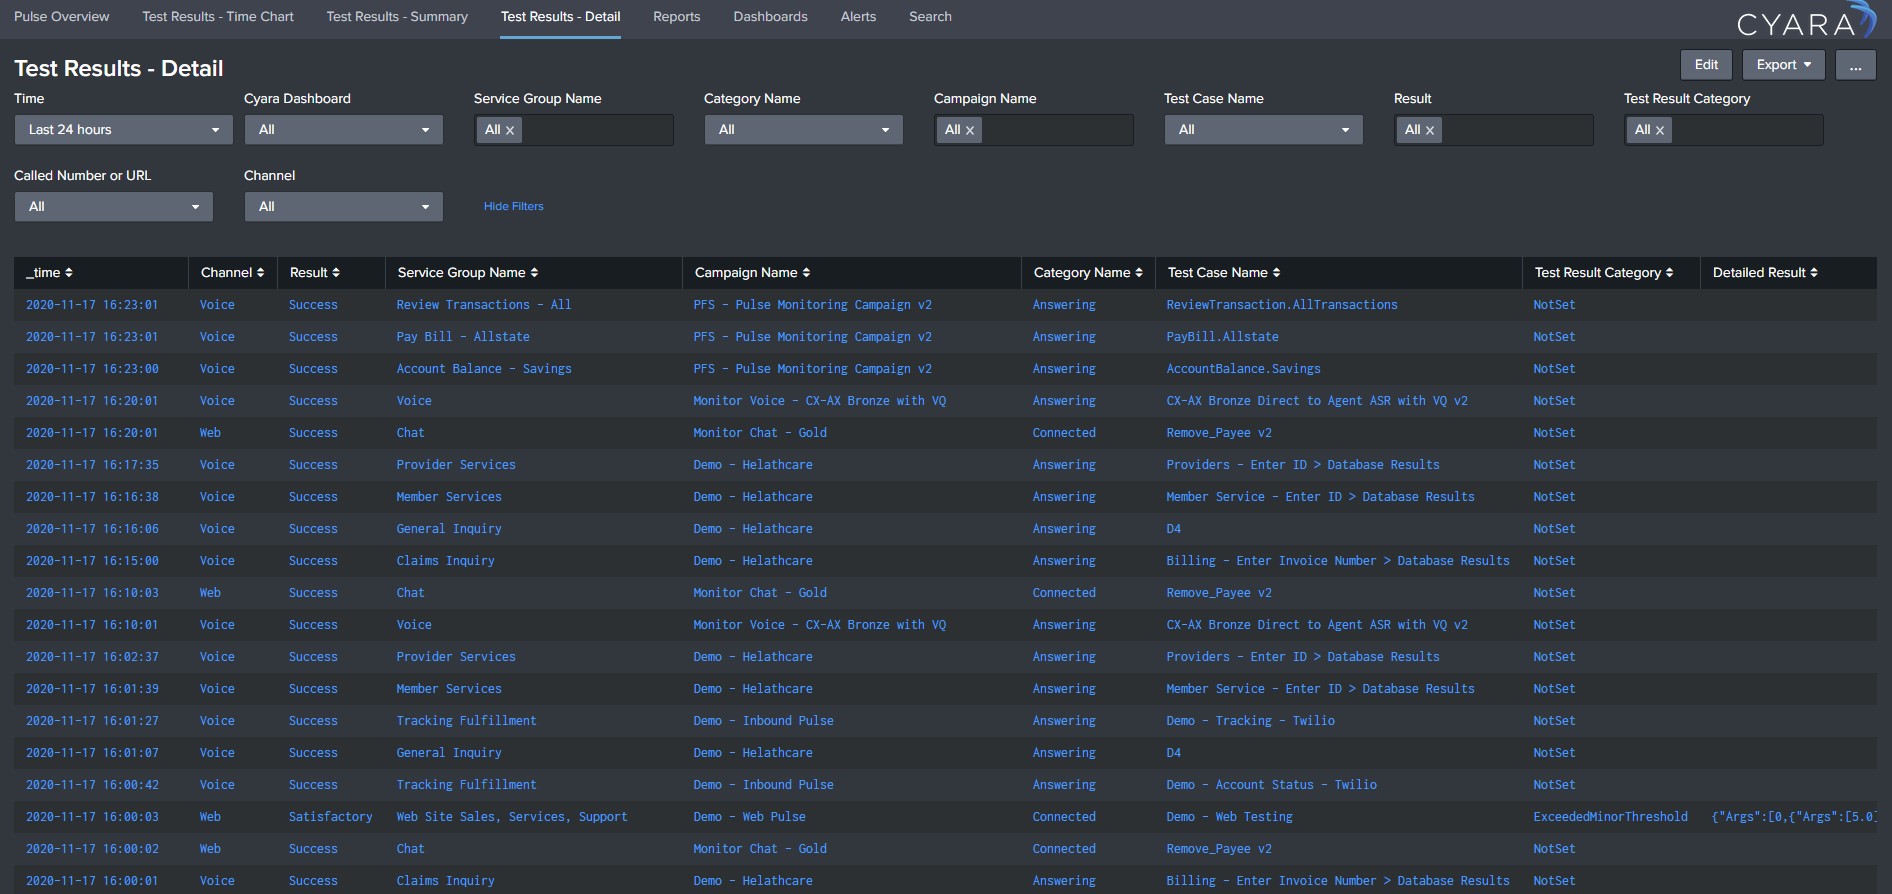
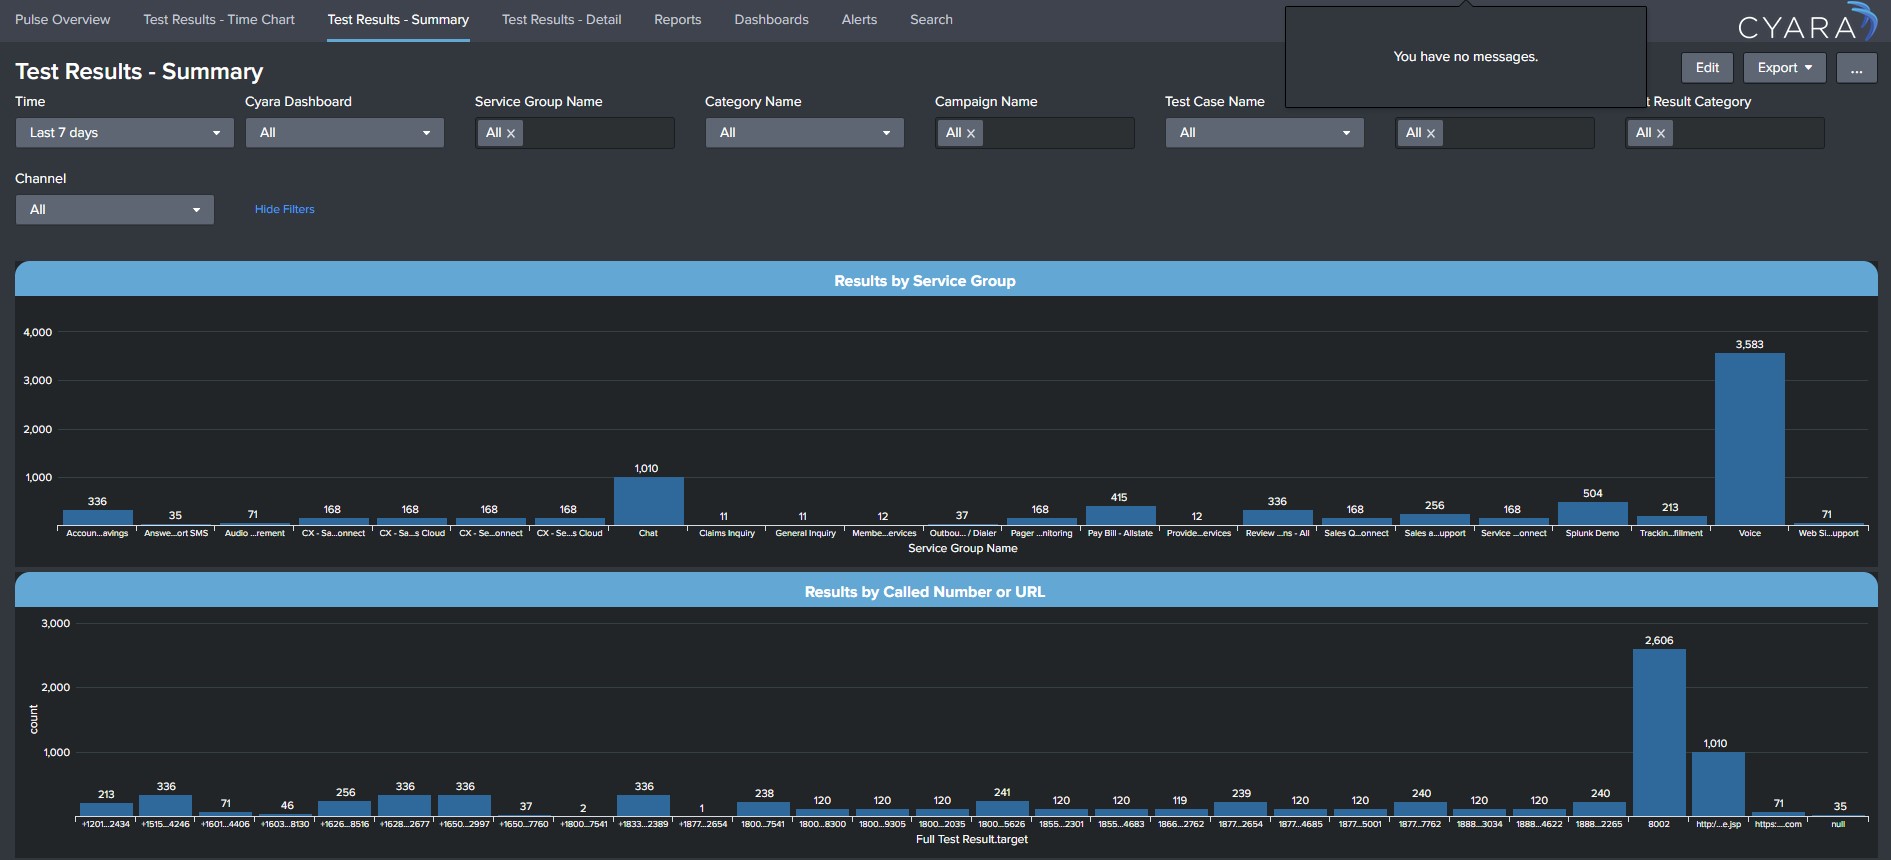
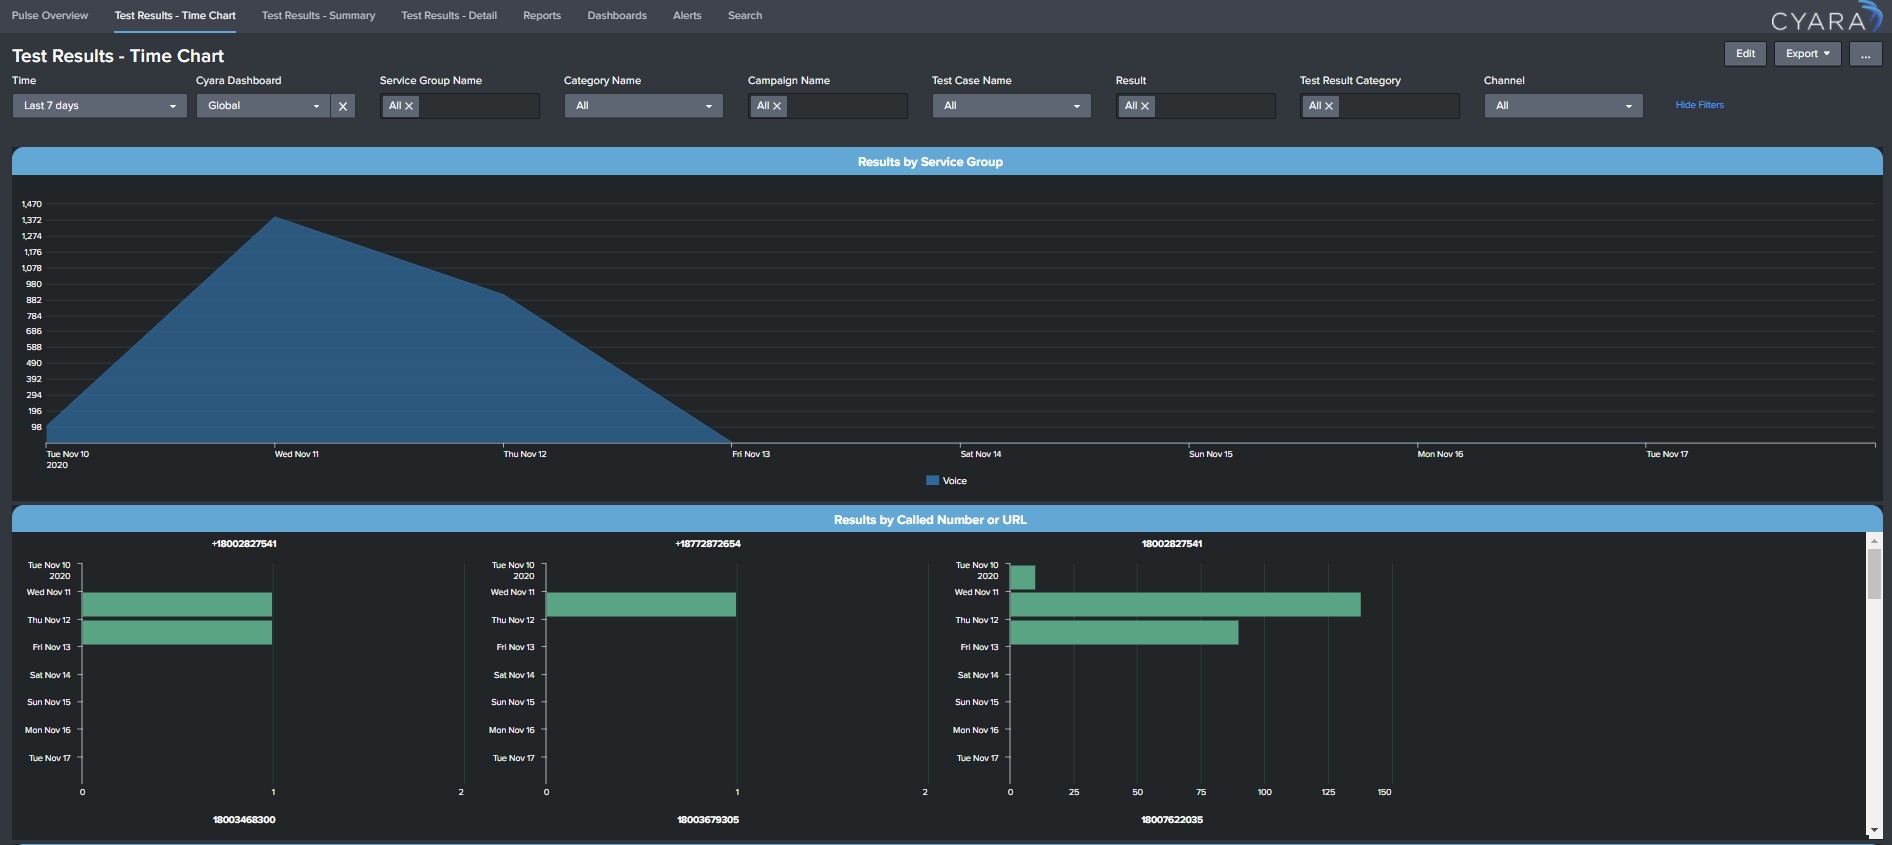
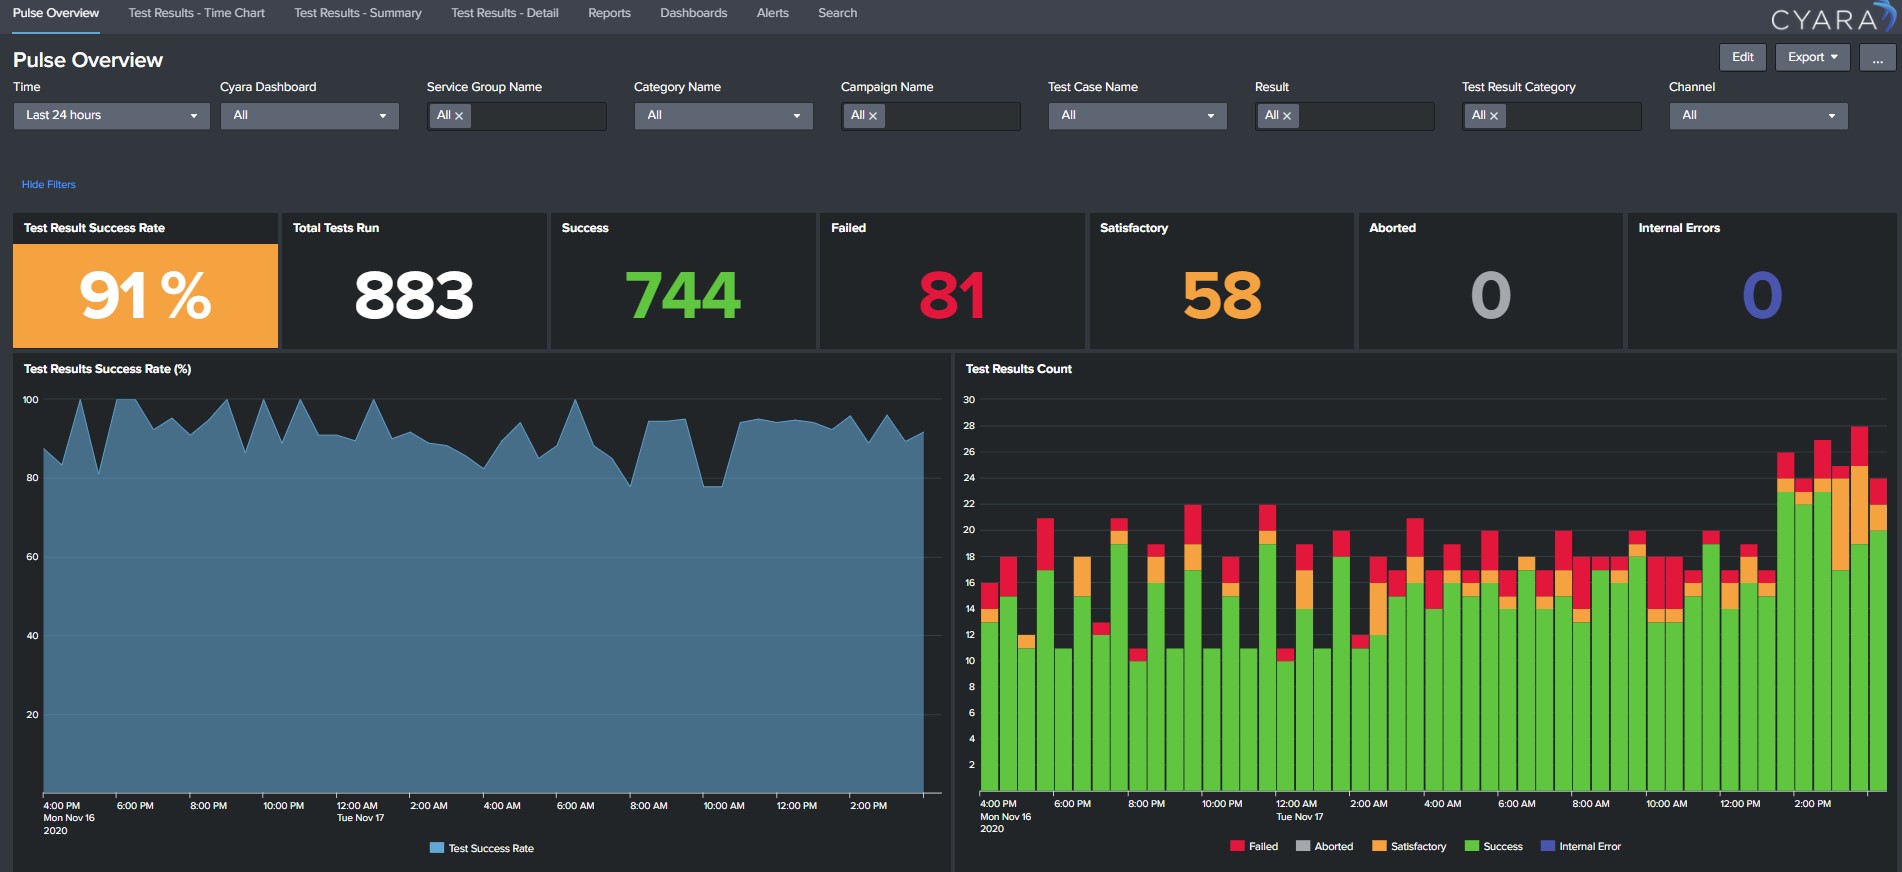
The Cyara Pulse App helps you analyze your CX Monitoring results from Cyara in Splunk. It is a set of pre-configured dashboards that help you glean valuable insights from the Cyara data. By enabling you to trend Cyara Pulse CX monitoring results over time (both short-term and long-term), these dashboards provide flexible visualizations to help you answer questions such as: - Which customer journeys are failing most frequently? - What are the most common issue categories impacting my customer's experience? - Which of my phone numbers being monitored are more prone to issues? - How does the performance of one business unit compare to others?
(3)
Categories
Created By
Contributors
Type
Downloads
Splunk Answers
Ask a question about this app listing(Opens new window)Resources