Default Version 1.0.0
September 4, 2020
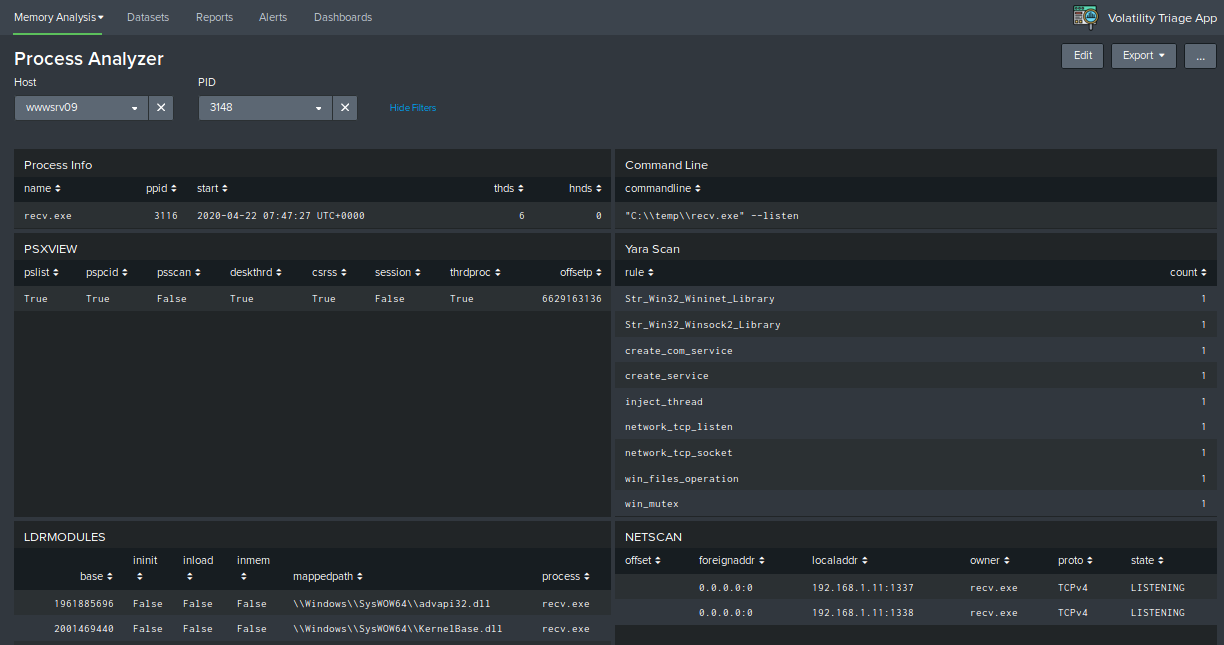
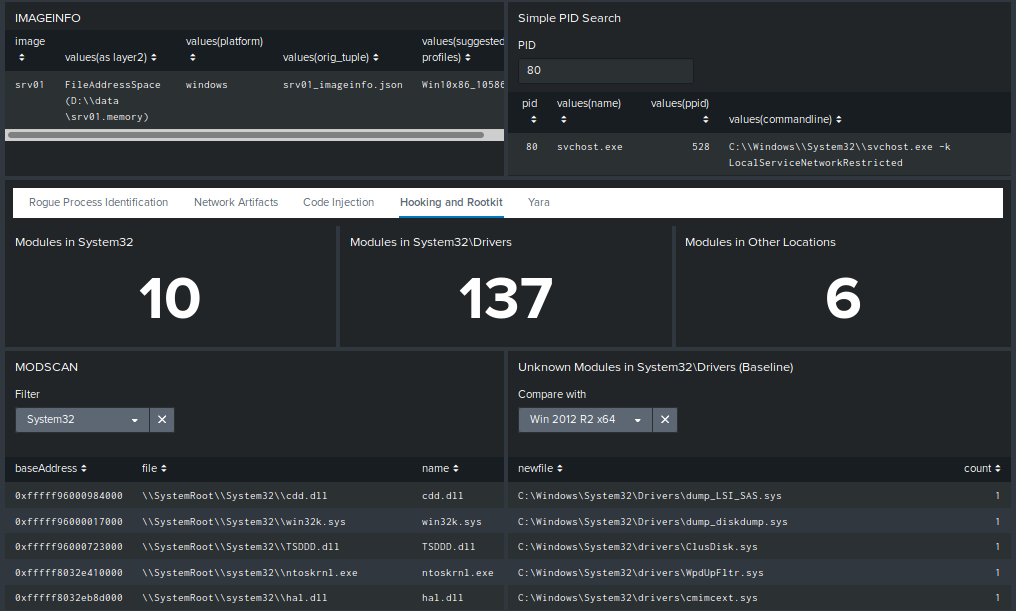
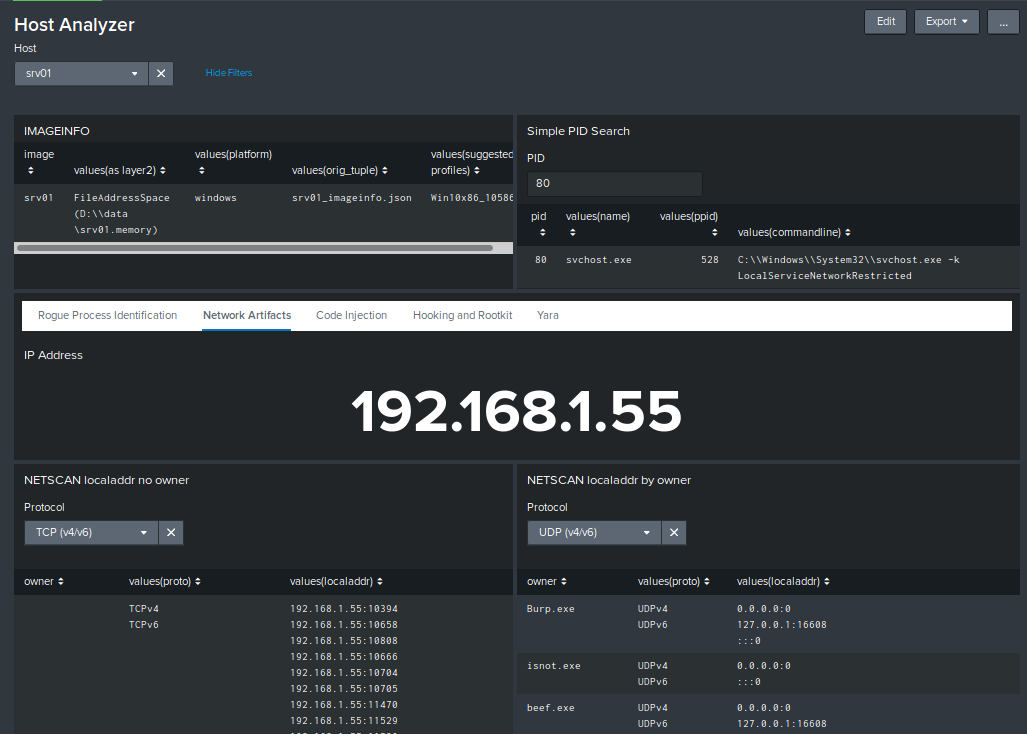
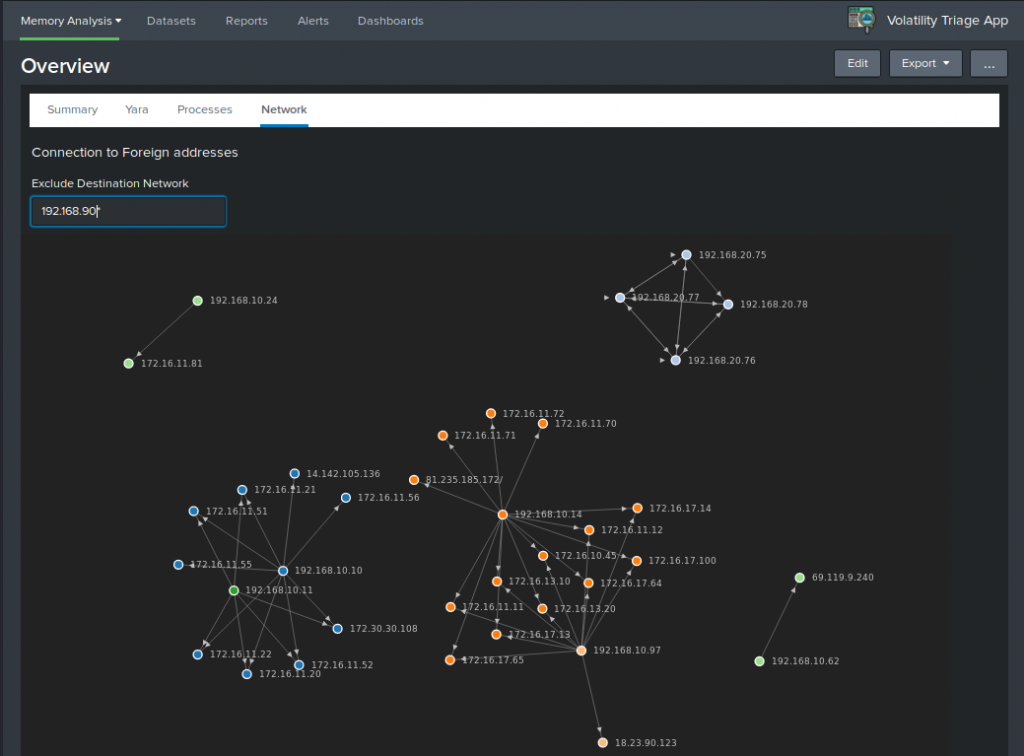
With this app and its dashboards you can analyze JSON output from some volatility commands in a practical way. After the import of the necessary data you can easily find outliers and low hanging fruits in case you have to analyze multiple hosts at once. The dashboards offer three different level of detail which ranges from a global view, to an host view, ending with a process view.
(0)
Categories
Created By
Type
Downloads
Splunk Answers
Ask a question about this app listing(Opens new window)Resources