Splunk’s SnapLogic Monitoring Solution helps organizations gain quick insights into their SnapLogic platform. The app comes with a powerful add-on that pulls the pipeline information from SnapLogic. The add-on also pulls all the necessary information about the number of messages processed in Snaplogic and also the health of your Snaplogic application. The purpose is to look into your pipeline runtime data for the specified Organization and time, and alerting on anomalies. It also pulls the health data from the Snaplogic groundplex and Cloud plex server which includes the status of all the snaplex nodes for the purpose of searching, monitoring, correlating, reporting, alerting and troubleshooting. Lay the foundation for your organization’s end-to-end process observability and run IT operations and business efficiently. Go from data to actionable business insights today.
CENTRALIZED MONITORING FOR SNAPLOGIC ORGS
An organizational landscape is built of multiple orgs. Monitor all your Snaplogic orgs from one dashboard.
IDENTIFY AND ALERT OVER PERFORMANCE BOTTLE NECKS
Specialized dashboard panels to pinpoint performance bottlenecks and alert capabilities in case of performance degradations. With one click you can switch between them.
KEY FEATURES
By leveraging Splunk’s capabilities, the solution packs pre-defined data models with add-on and prebuilt dashboards. This guarantees a seamless and fast setup. Get up and running in a matter of hours. Start your Snaplogic observability journey today.
- Integration content:
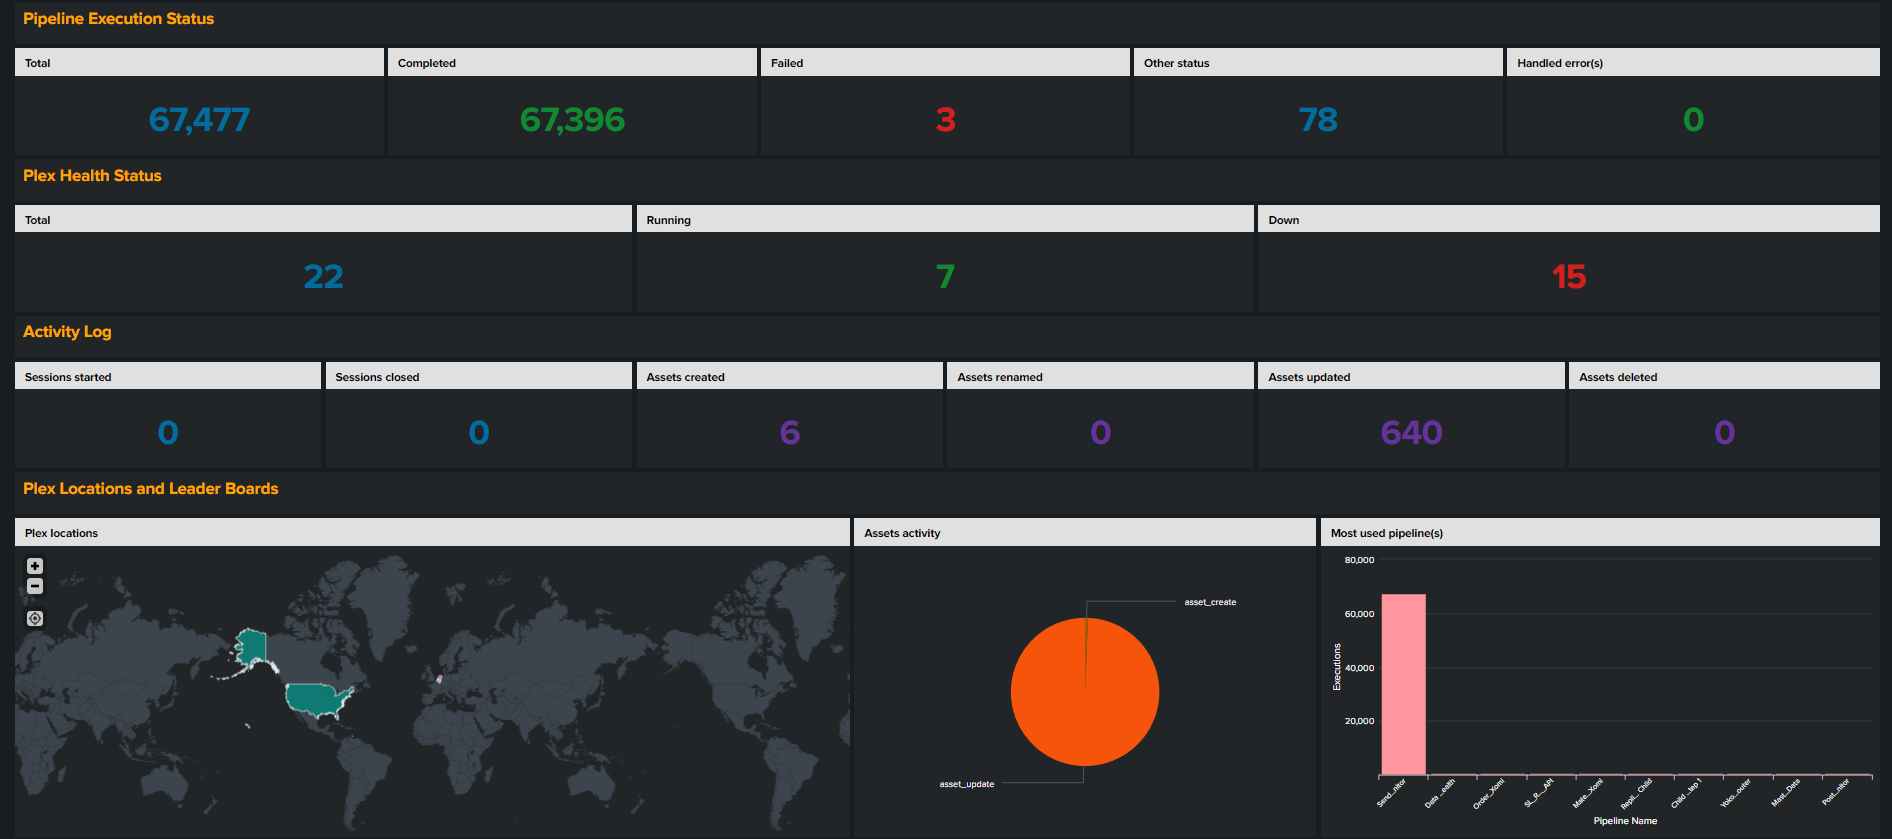
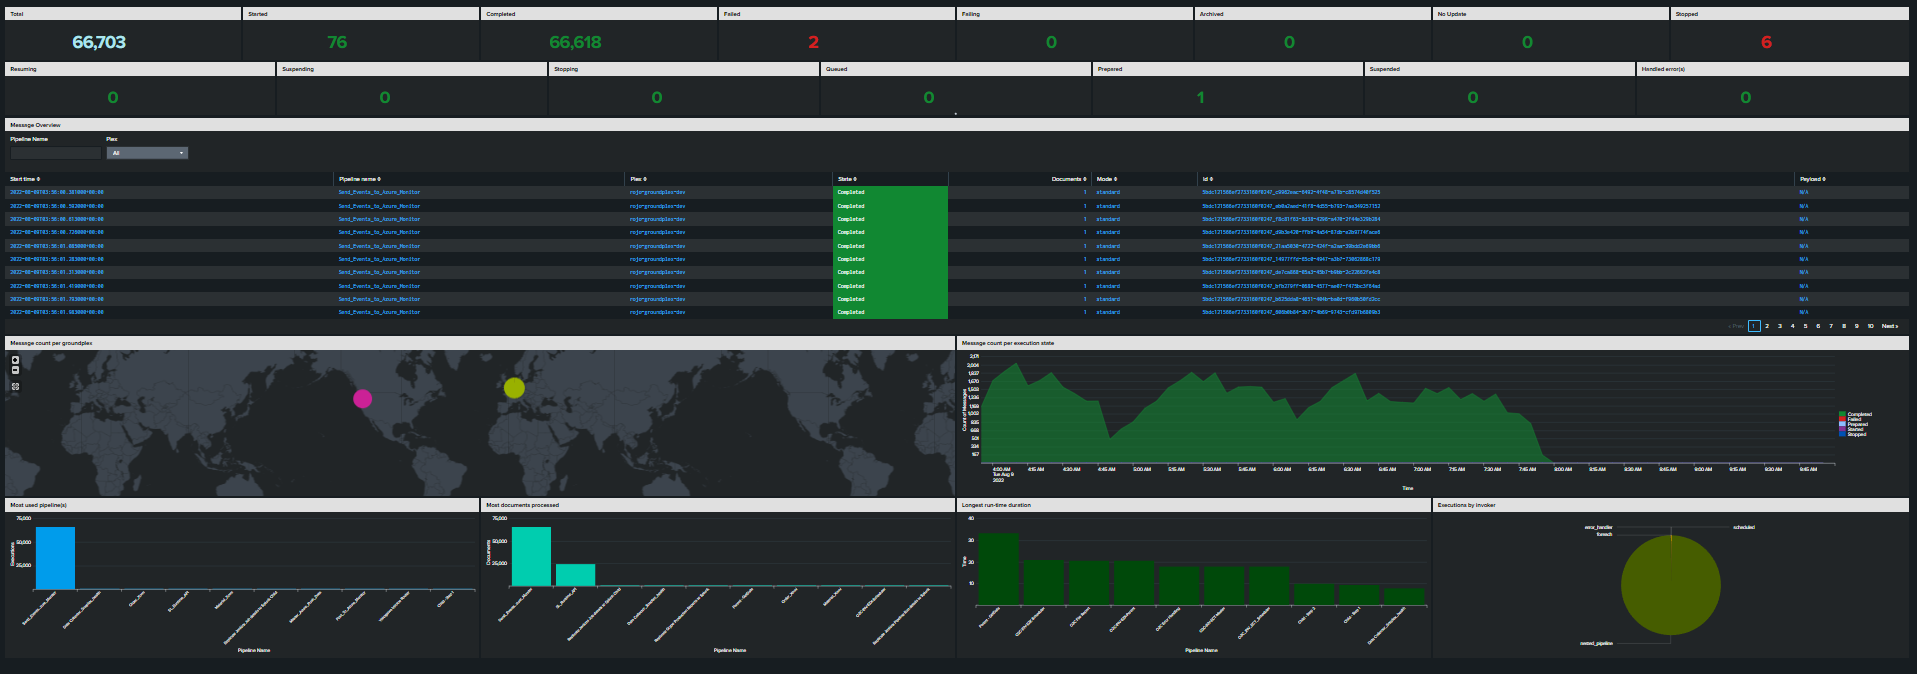
Look into your pipeline runtime data for the specified Organization and time, check the status for all the pipelines in different execution statuses
- Troubleshooting insights:
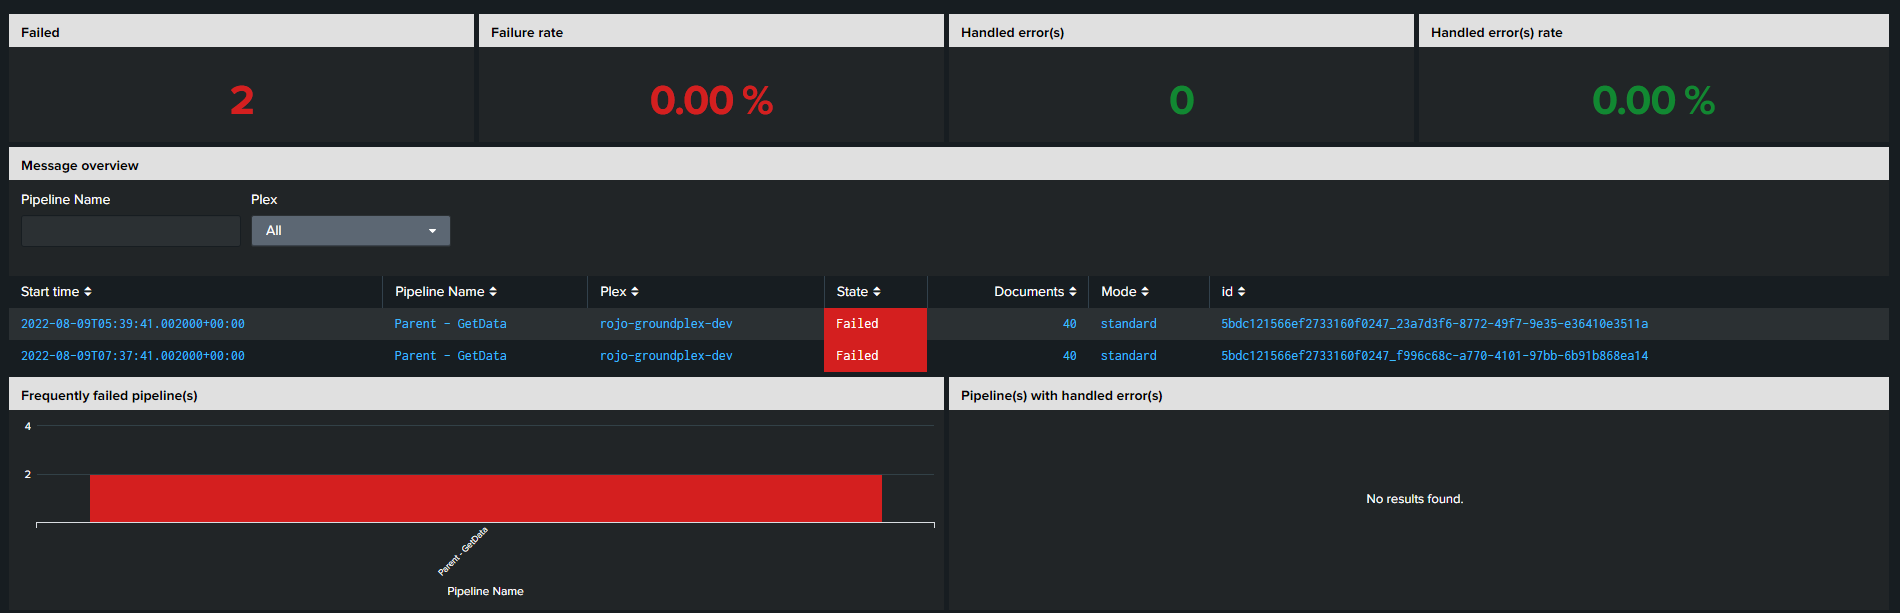
Get detailed insight on failed messages and executions that were handled using the error handling pipeline.
- Snaplex health:
Check information about all the nodes in the organization
- Activity Monitoring:
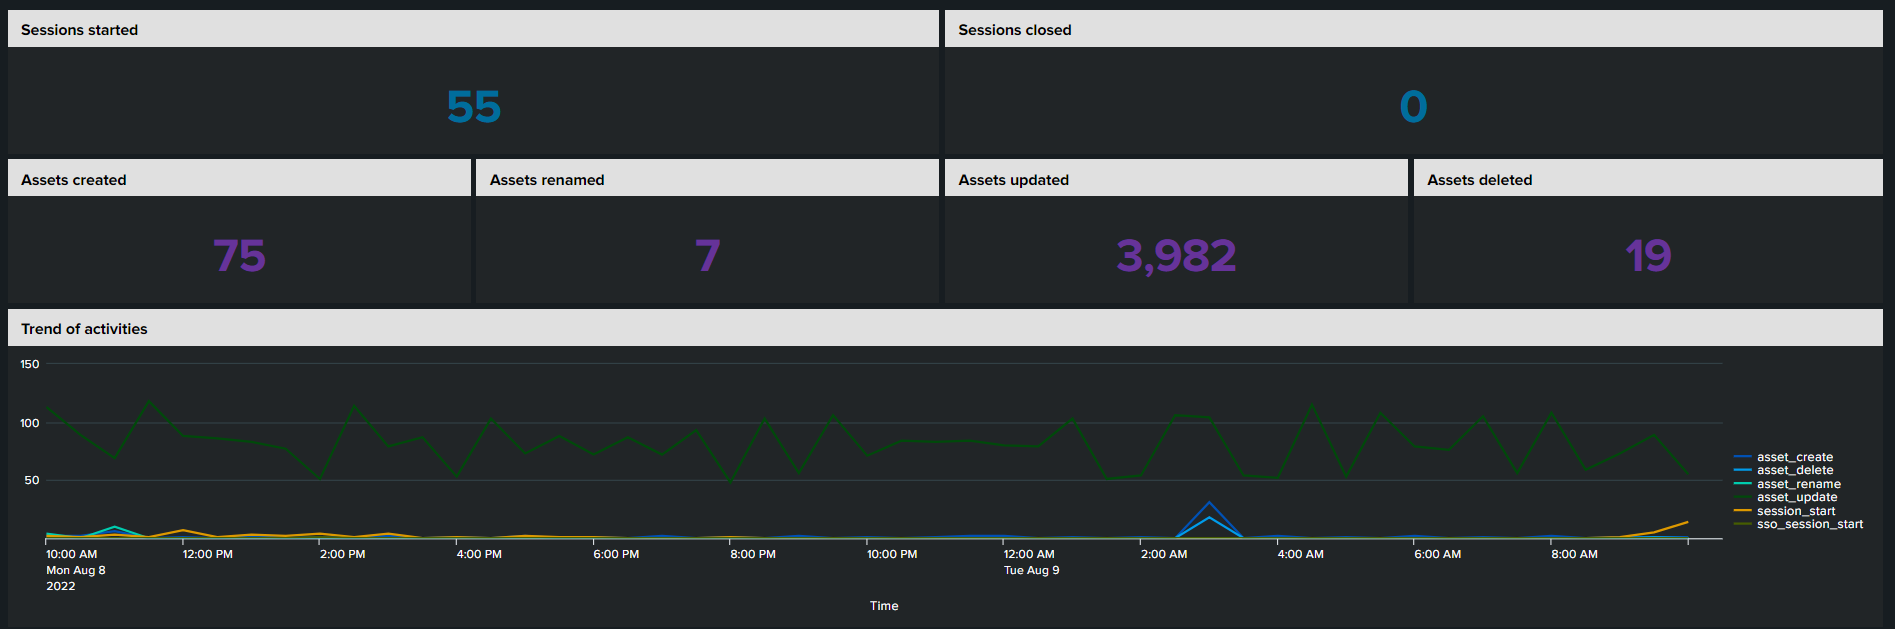
Dive into the information about activities within the org and check session, user, access, password, and plex related activities.
- User Activity:
Get an overview and details of users with expired passwords, locked accounts, active users, service accounts etc. This dashboard also shows activities performed on assets by the user over time in the SnapLogic tenant for any Orgs.
- Task Metrics
A quick view and visualization of tasks executed in SnapLogic that is exposed as a REST endpoint in Snaplogic.
- AI and machine learning:
Apply Splunk’s out of the box machine learning and AI-capabilities to the integration data. In this way, you can detect anomalies and predict and prevent integration issues.
- Free text search:
Search all your Snaplogic data from one screen.
Release Notes:
V6.0.0
Note: This app is developed and fully supported by Rojo Consultancy.