Default Version 1.0.1
December 12, 2017
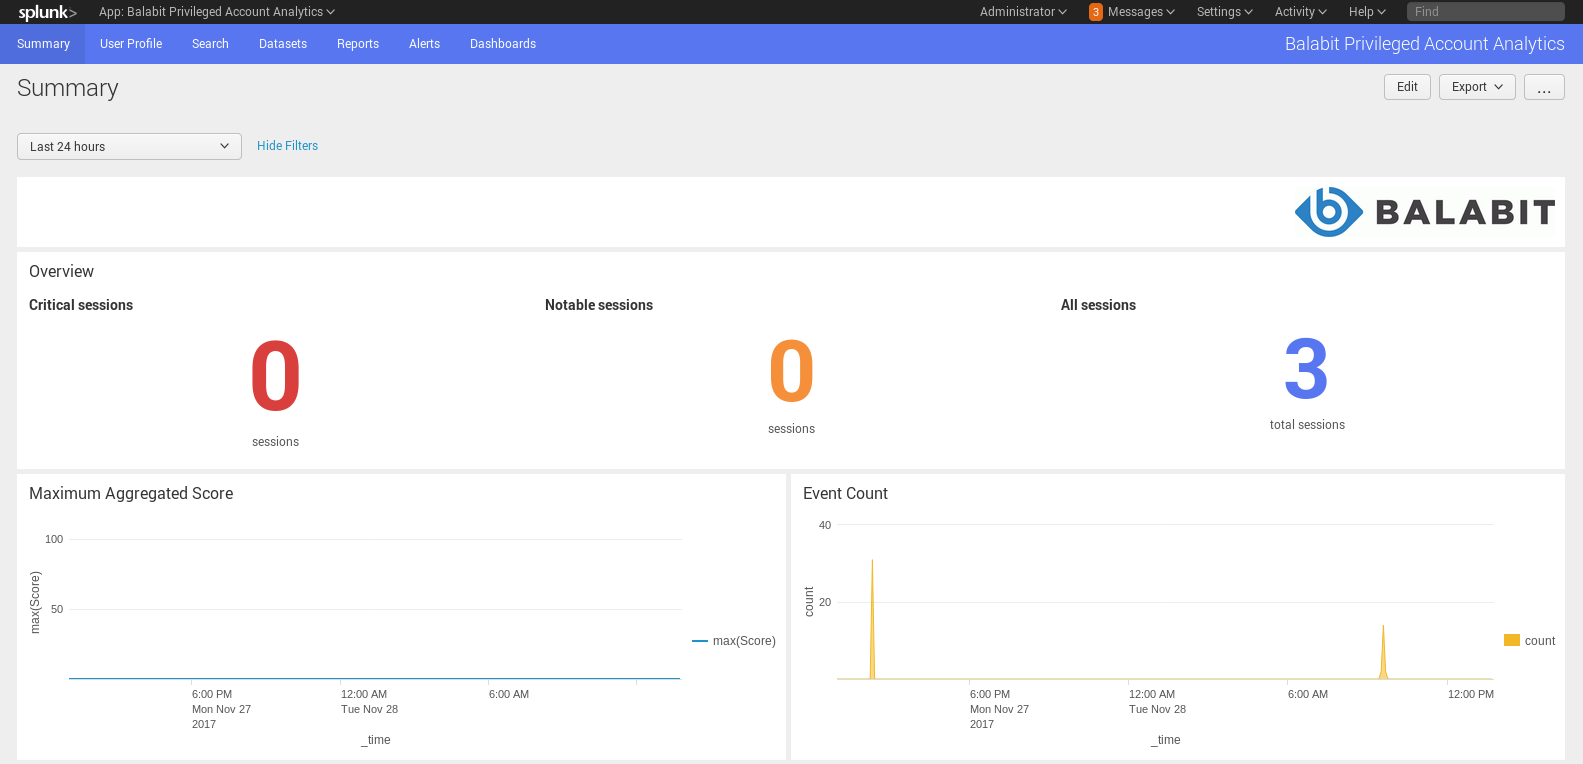
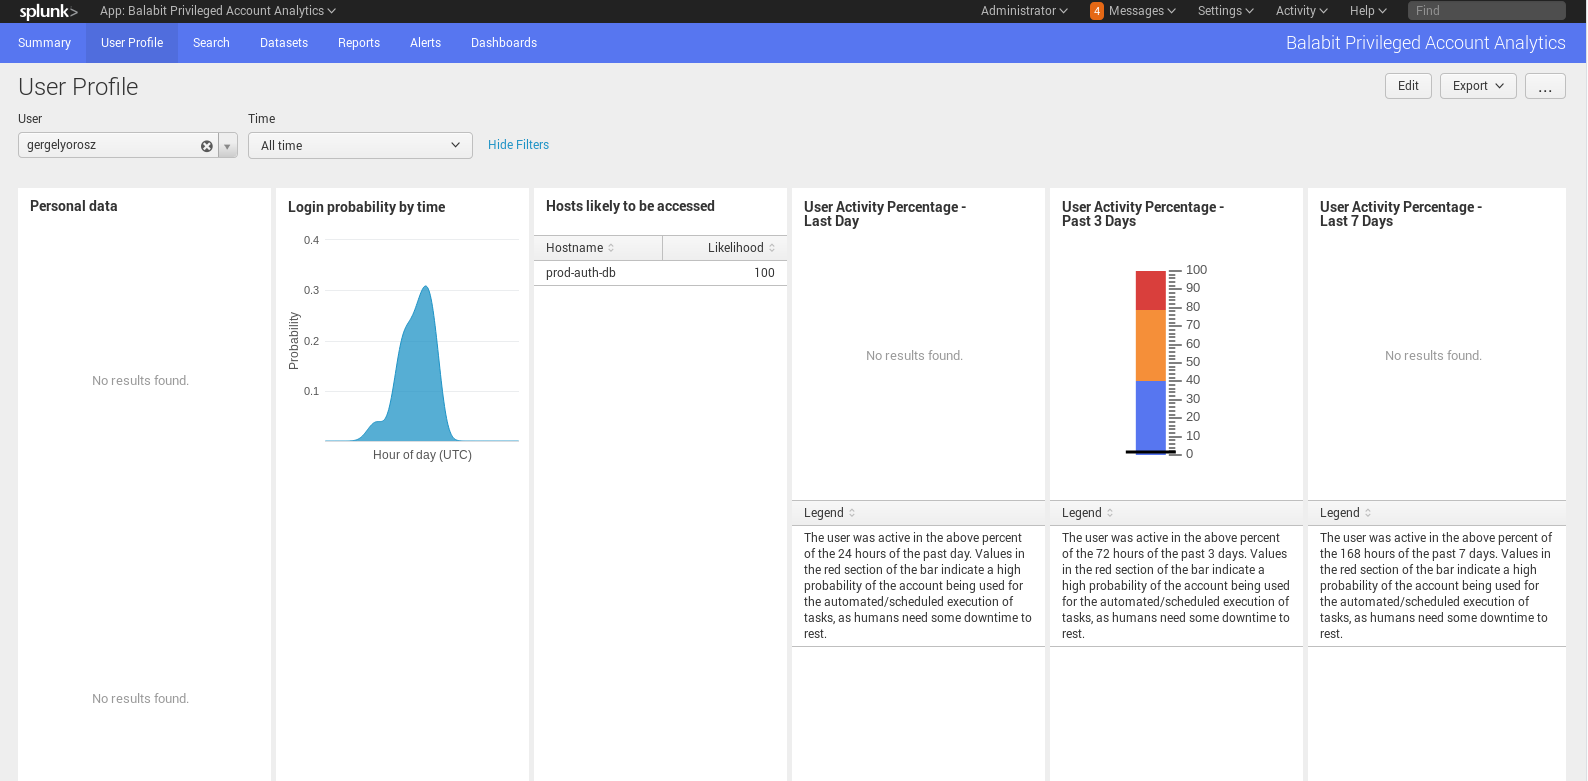
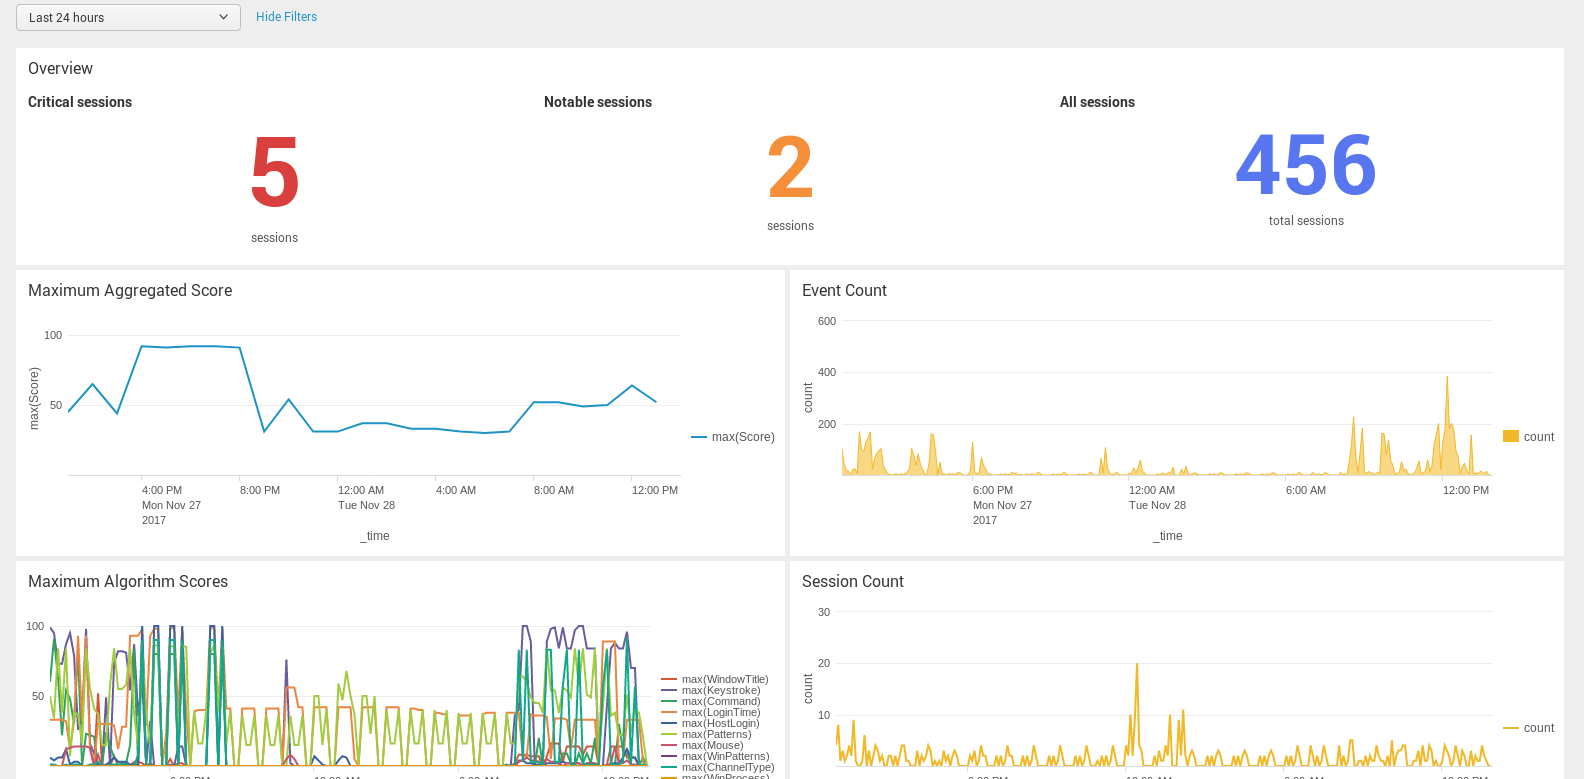
Balabit’s Privileged Account Analytics (PAA) integrates detailed data from Balabit's Privileged Session Management solution, as well as a variety of contextual data and processes them using unique sets of algorithms, generating behavior profiles that are continually adjusted using machine learning. For example, PAA can perform behavioral biometric analysis, which detects deviations in keystroke dynamics and mouse movements providing continuous authentication without users changing any of their normal behavior.
(1)
Categories
Created By
Type
Downloads
Licensing
MIT(Opens new window)Splunk Answers
Ask a question about this app listing(Opens new window)Resources