Latest Version 1.0.4
August 14, 2020
This app is archived. App archiving documentation
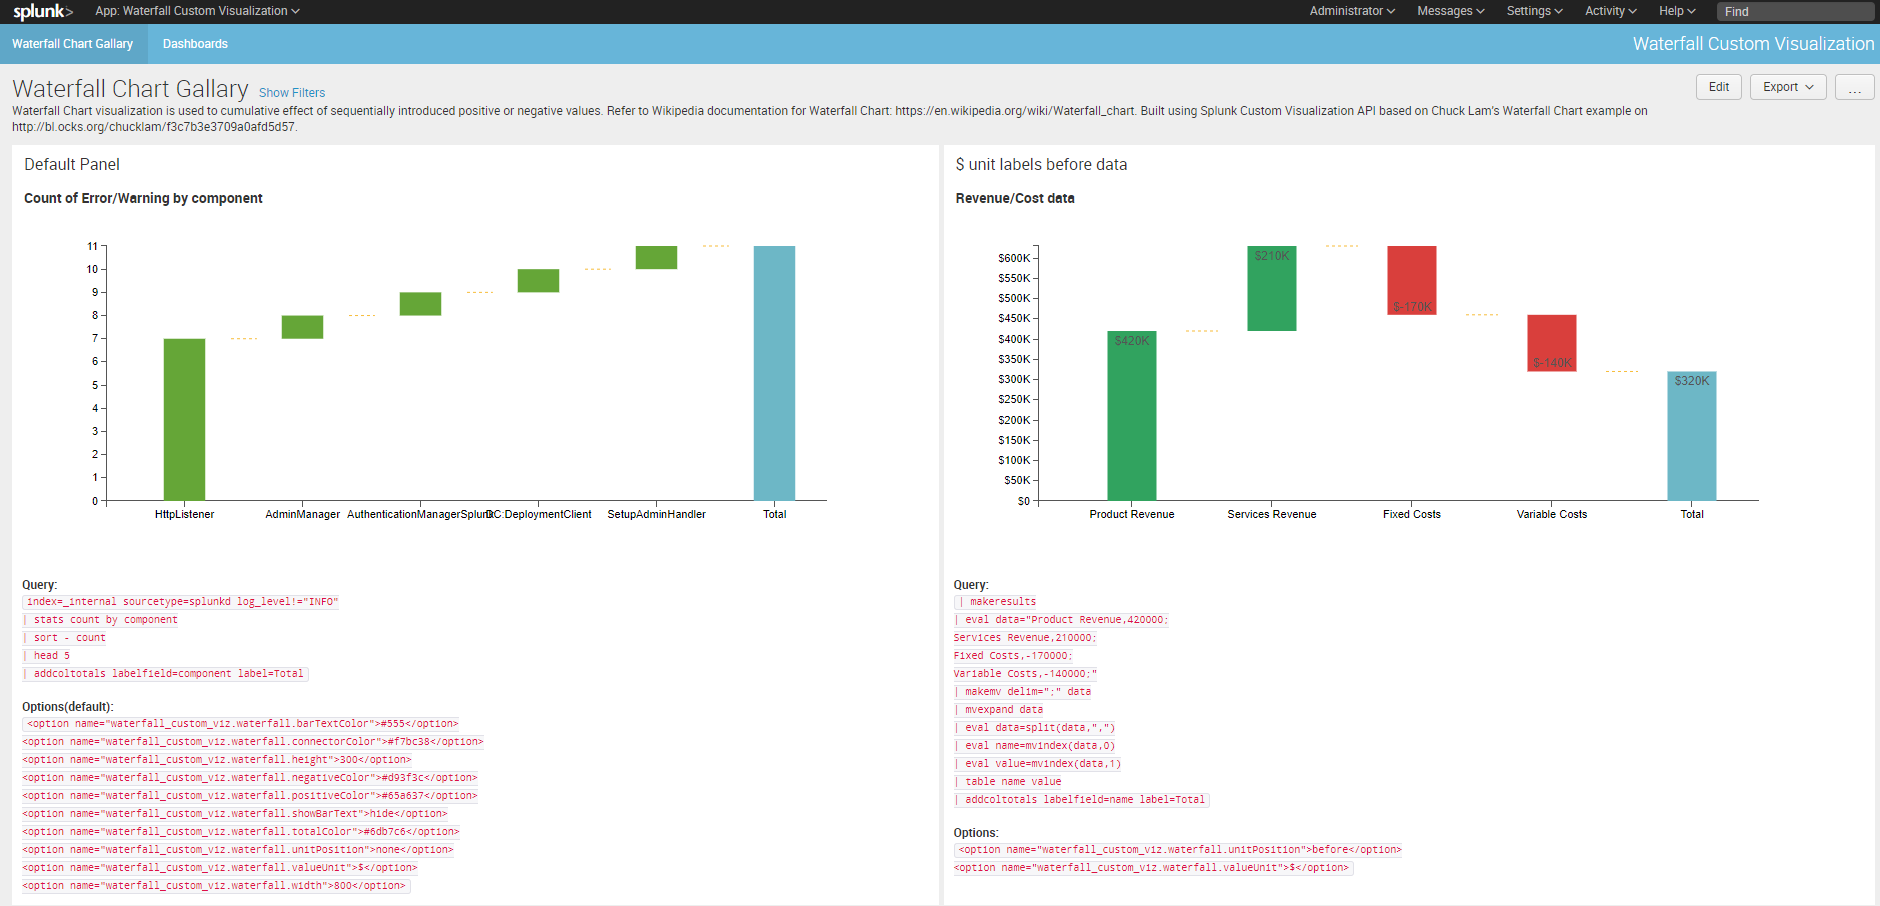
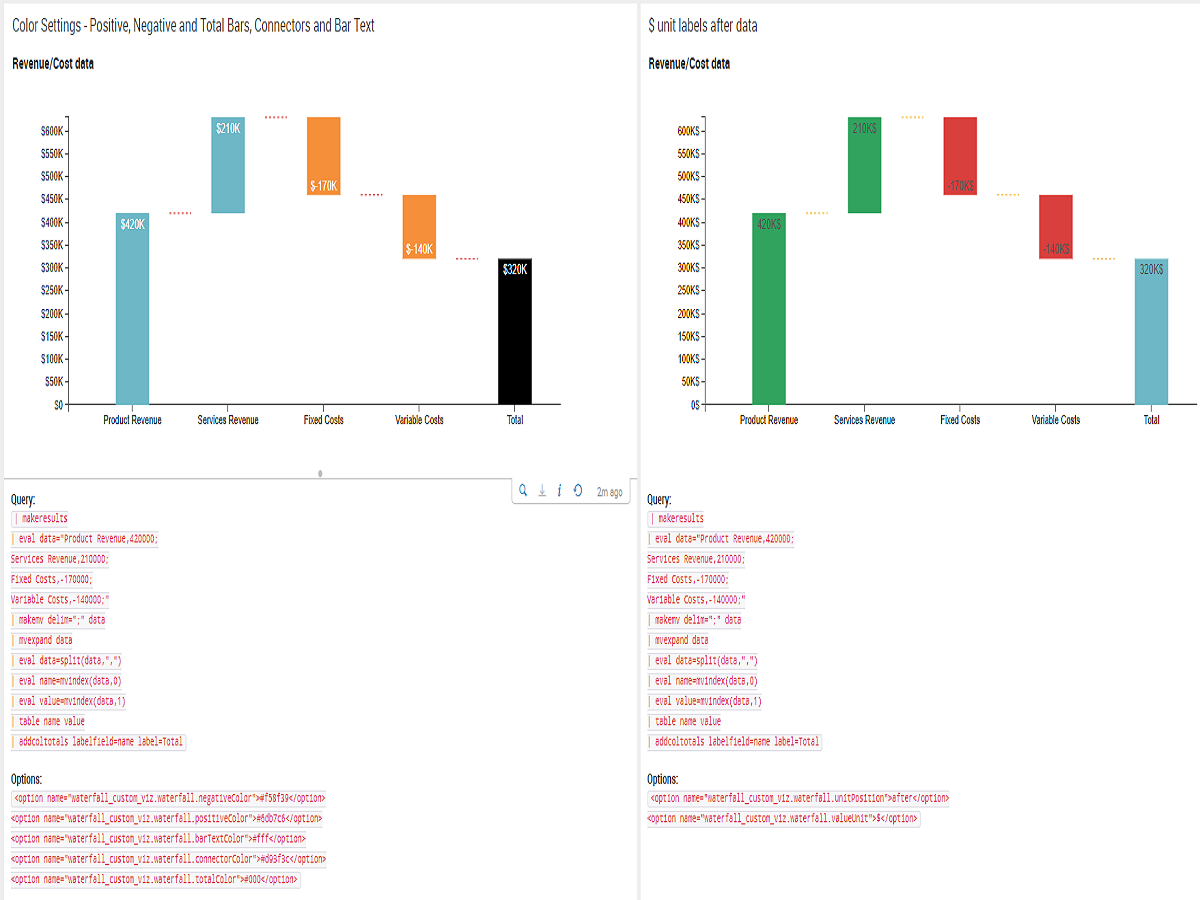
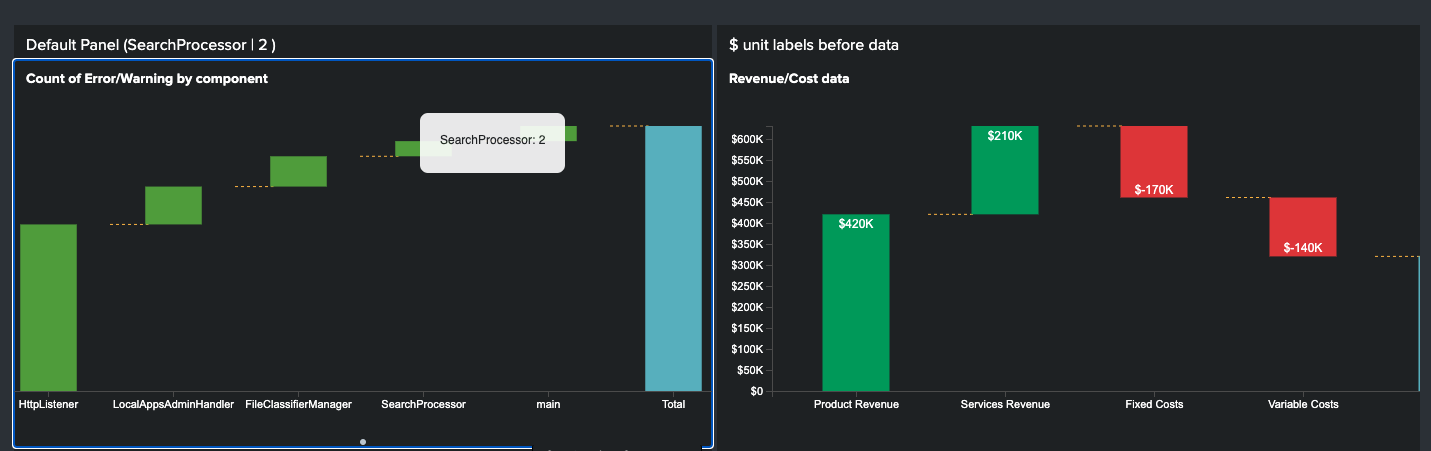
Waterfall Custom Visualization App is based on Splunk's custom visualization API updated for Splunk software version 6.5. After installing this app Waterfall Custom Visualization should show up as an App in the Splunk App List. It will also show up in the visualization picker in Search and Dashboard.
(0)
Categories
Created By
Type
Downloads
Splunk Answers
Ask a question about this app listing(Opens new window)Resources