Default Version 3.1.0
April 14, 2022
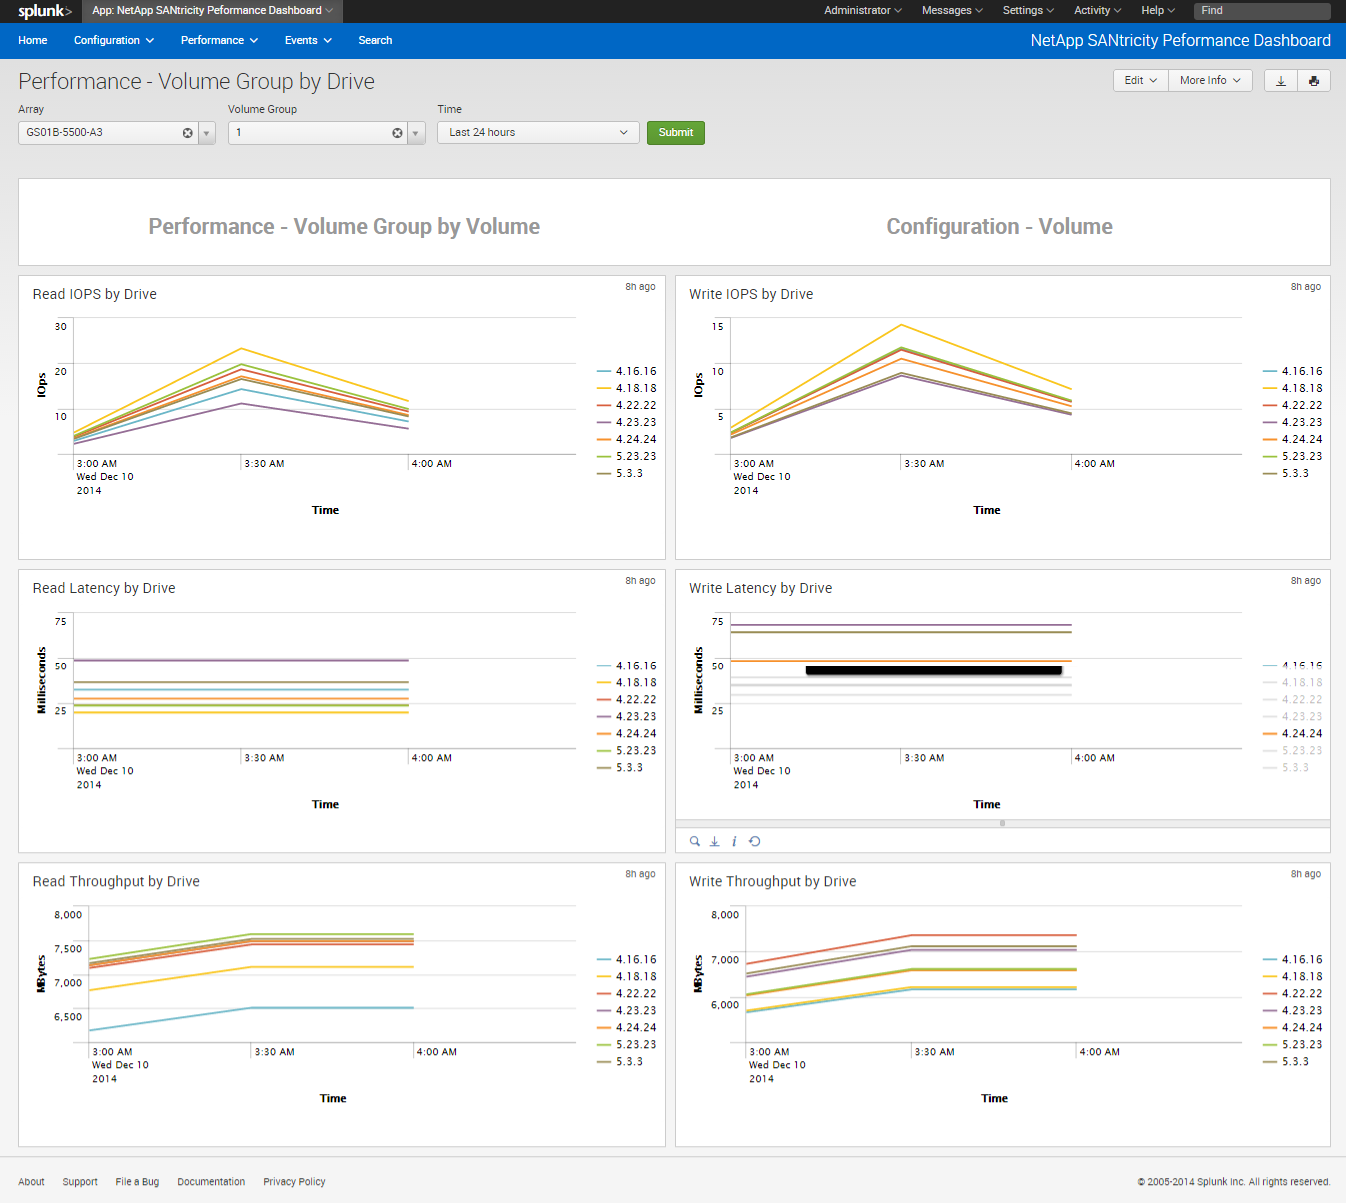
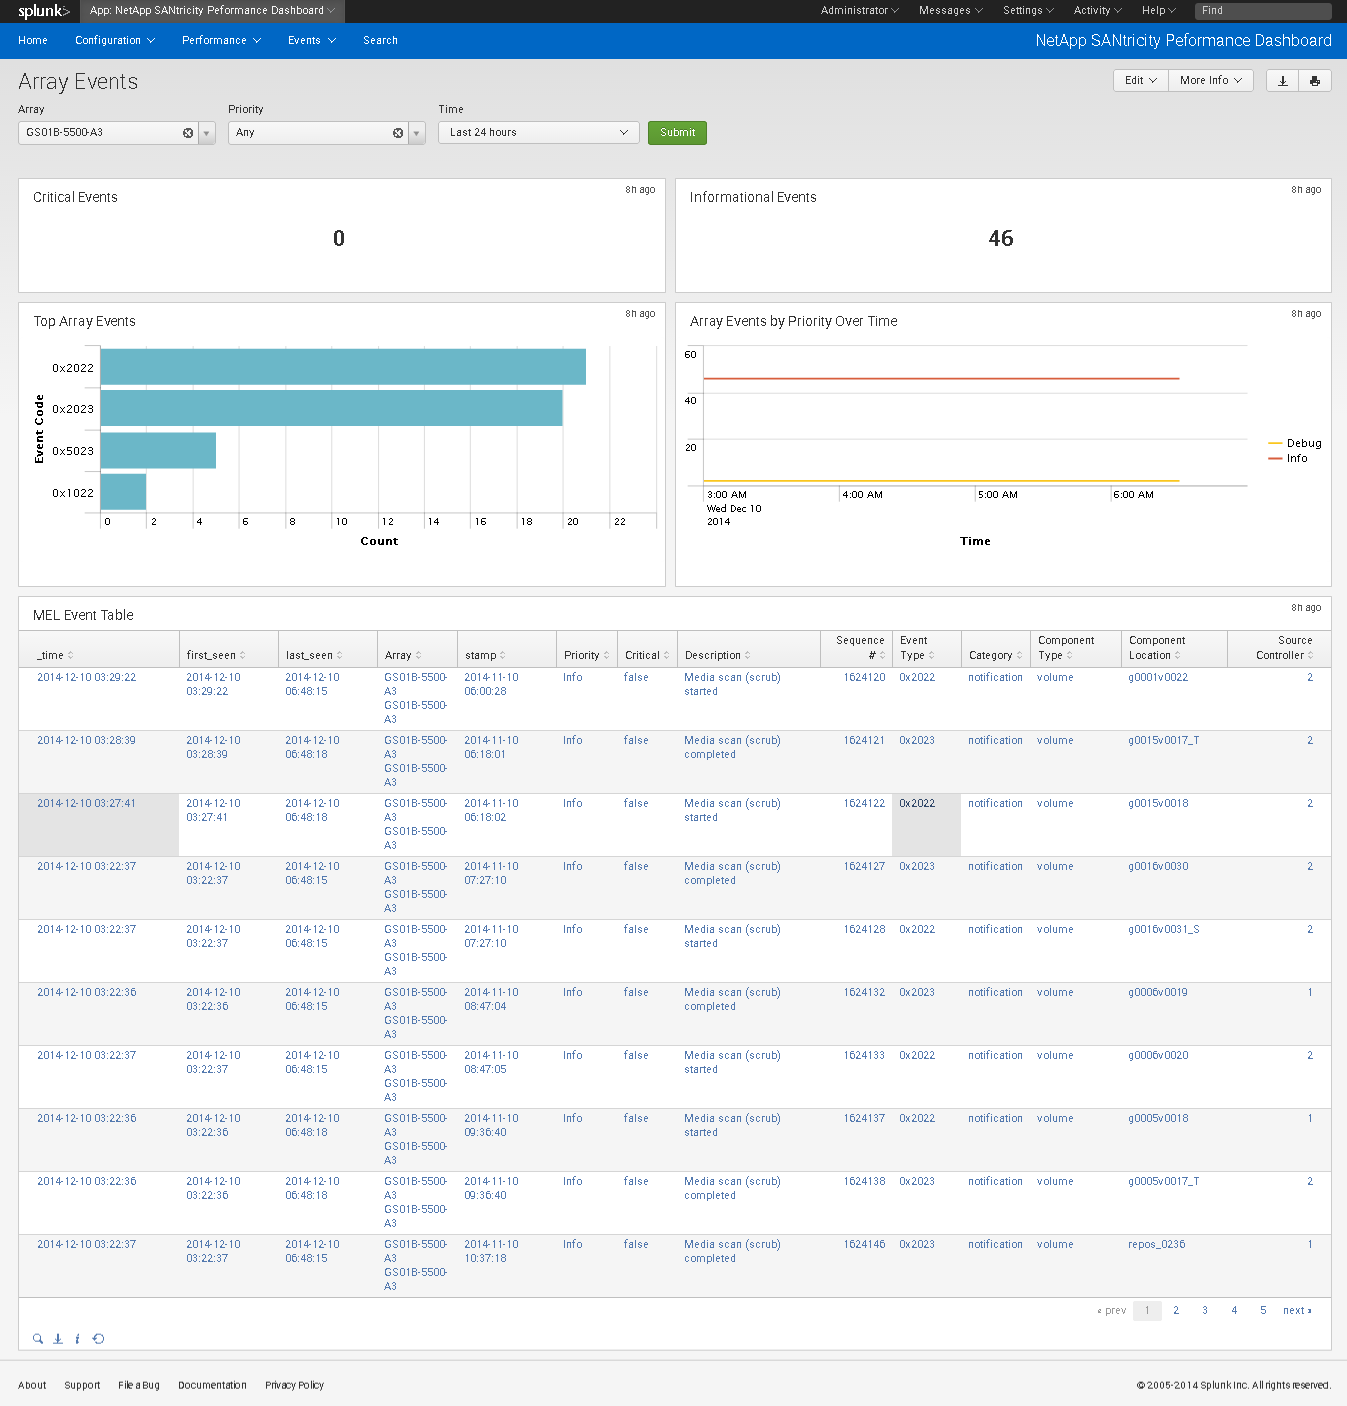
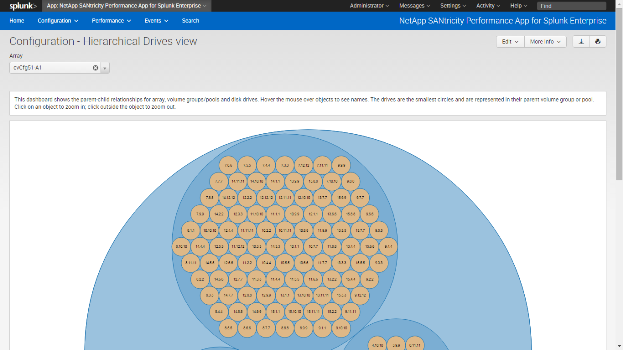
The NetApp SANtricity Performance App for Splunk Enterprise provides visibility into the health and performance of NetApp E-Series and EF-Series storage systems.

(1)
Categories
Created By
Type
Downloads
Splunk Answers
Ask a question about this app listing(Opens new window)Resources