Splunk GUI for SysStat
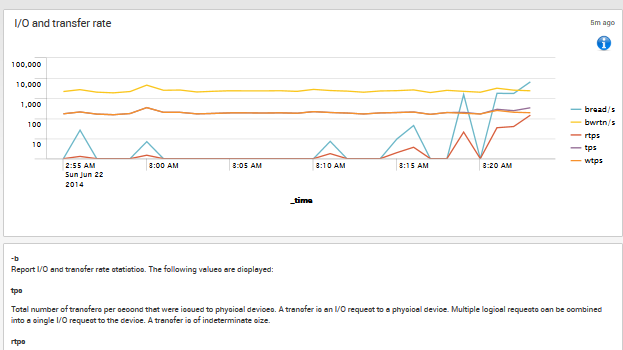
The Splunk GUI for SysStat provides visualization of the system activity collected with the SysStat package. This includes I/O transfer rates, paging activity, process-related activities, interrupts, network activity, memory and swap space utilization, CPU utilization among others. The statistics can be collected in near real-time from as many hosts as you like (potentially thousands). The SysStat package is already present in all major Linux distributions and likely already installed, is a non-intrusive, secure and lightweight way to collect system activity information.
Imagine being able to see output of vmstat, sar or iostat for any period in the past!
A unique feature of the app is the ability to show any available parameters of your choice in one graph.
It is suitable for an ad-hoc or permanent advanced performance troubleshooting and profiling.
The analysis of historical performance data and the detection of bottlenecks allows the establishment of a baseline of the resource usage, predicts utilization and reduces costs, especially in cloud environment like AWS.
The UI has contextual help for every graph, which provides explanations of the parameters and suggests optimizations.
Resources
Log in to report this app listing