Default Version 1.0.7
February 25, 2026
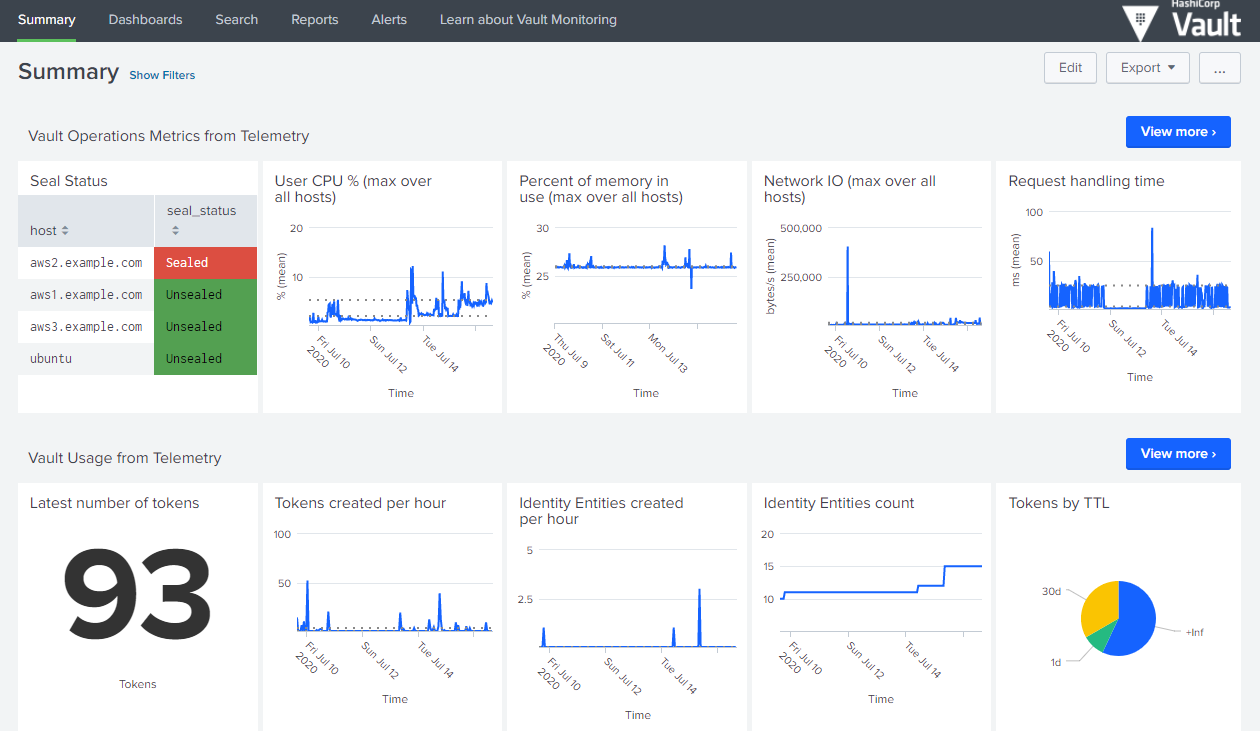
Hashicorp Vault Enterprise users can take advantage of this Splunk® app to understand Vault from an operational and security perspective. The Splunk app includes powerful dashboards that split metrics into logical groupings targeting both operators and security teams. The app can be used with Splunk Enterprise as well as Splunk Cloud.


(3)
Categories
Created By
Type
Downloads
Featured in Collection
Splunk Answers
Ask a question about this app listing(Opens new window)Resources